Why Analog

One average return is not a plan.

One market return. One tax rate. Everyone lives to the same age, nobody moves house, and the answer is a single percentage. We built the other kind: analysis run the way a planning team runs it, with every number traceable back to the assumption and the transaction that produced it. Here is what that means, in detail.

Start the conversation →

At a glance

What gets assumed elsewhere is computed here.

Taxes One assumed rate for every year A federal and state return filled in for every year, on every path — including the extra taxes a big year brings Behind every number Figures you take on faith Open any figure to that year’s tax form — every rule applied, what each one was worth in dollars, and the transactions that triggered it The answer you get A score for the plan you typed in We solve for your numbers — the most you can spend each month, and the earliest you can stop working Mortgages & debt A guessed monthly payment Paid down on their real terms — payoff date, interest deduction and all Stock grants Lumped into salary Vesting on their own calendar, taxed the year they vest — and a large single-stock position is never quietly sold off Retirement accounts A flat savings and drawdown rate Contribution limits, the employer match, the withdrawals required after 73, and Roth conversions spread over the years you pick Lifespans Everyone lives to the same age Drawn from the government’s life tables, different on every path — income stops, the survivor’s benefit begins, the tax changes with it Insurance A checklist beside the plan Premiums paid out of your own cash flow, benefits arriving where they are needed — and a word when a policy stops earning its premium Estate Out of scope Settled at the end — your will, your trusts, the beneficiary named on each account, the tax, and every question no document of yours answered The assistant A chat window that explains the page Works on the plan itself — models the change, saves both futures side by side, and makes the update once you approve it

Every row links to the detail below.

The analysis

A thousand futures, each one taxed year by year.

Your plan is tested against 1,000 simulated market paths — a Monte Carlo analysis. On every one of those paths we compute your federal and state tax year by year, apply the contribution limits and the withdrawals required after age 73, vary lifespans the way real ones vary, and settle your estate at the end. An average-return projection gives you one path; this gives you a thousand, and reports the range.

1,000

simulated market paths behind every number

Every year

federal and state tax computed on each path

Every life

lifespans vary from one path to the next

Solved

your spending ceiling and your earliest retirement age

Every number, traceable

Ask any number where it came from. It answers.

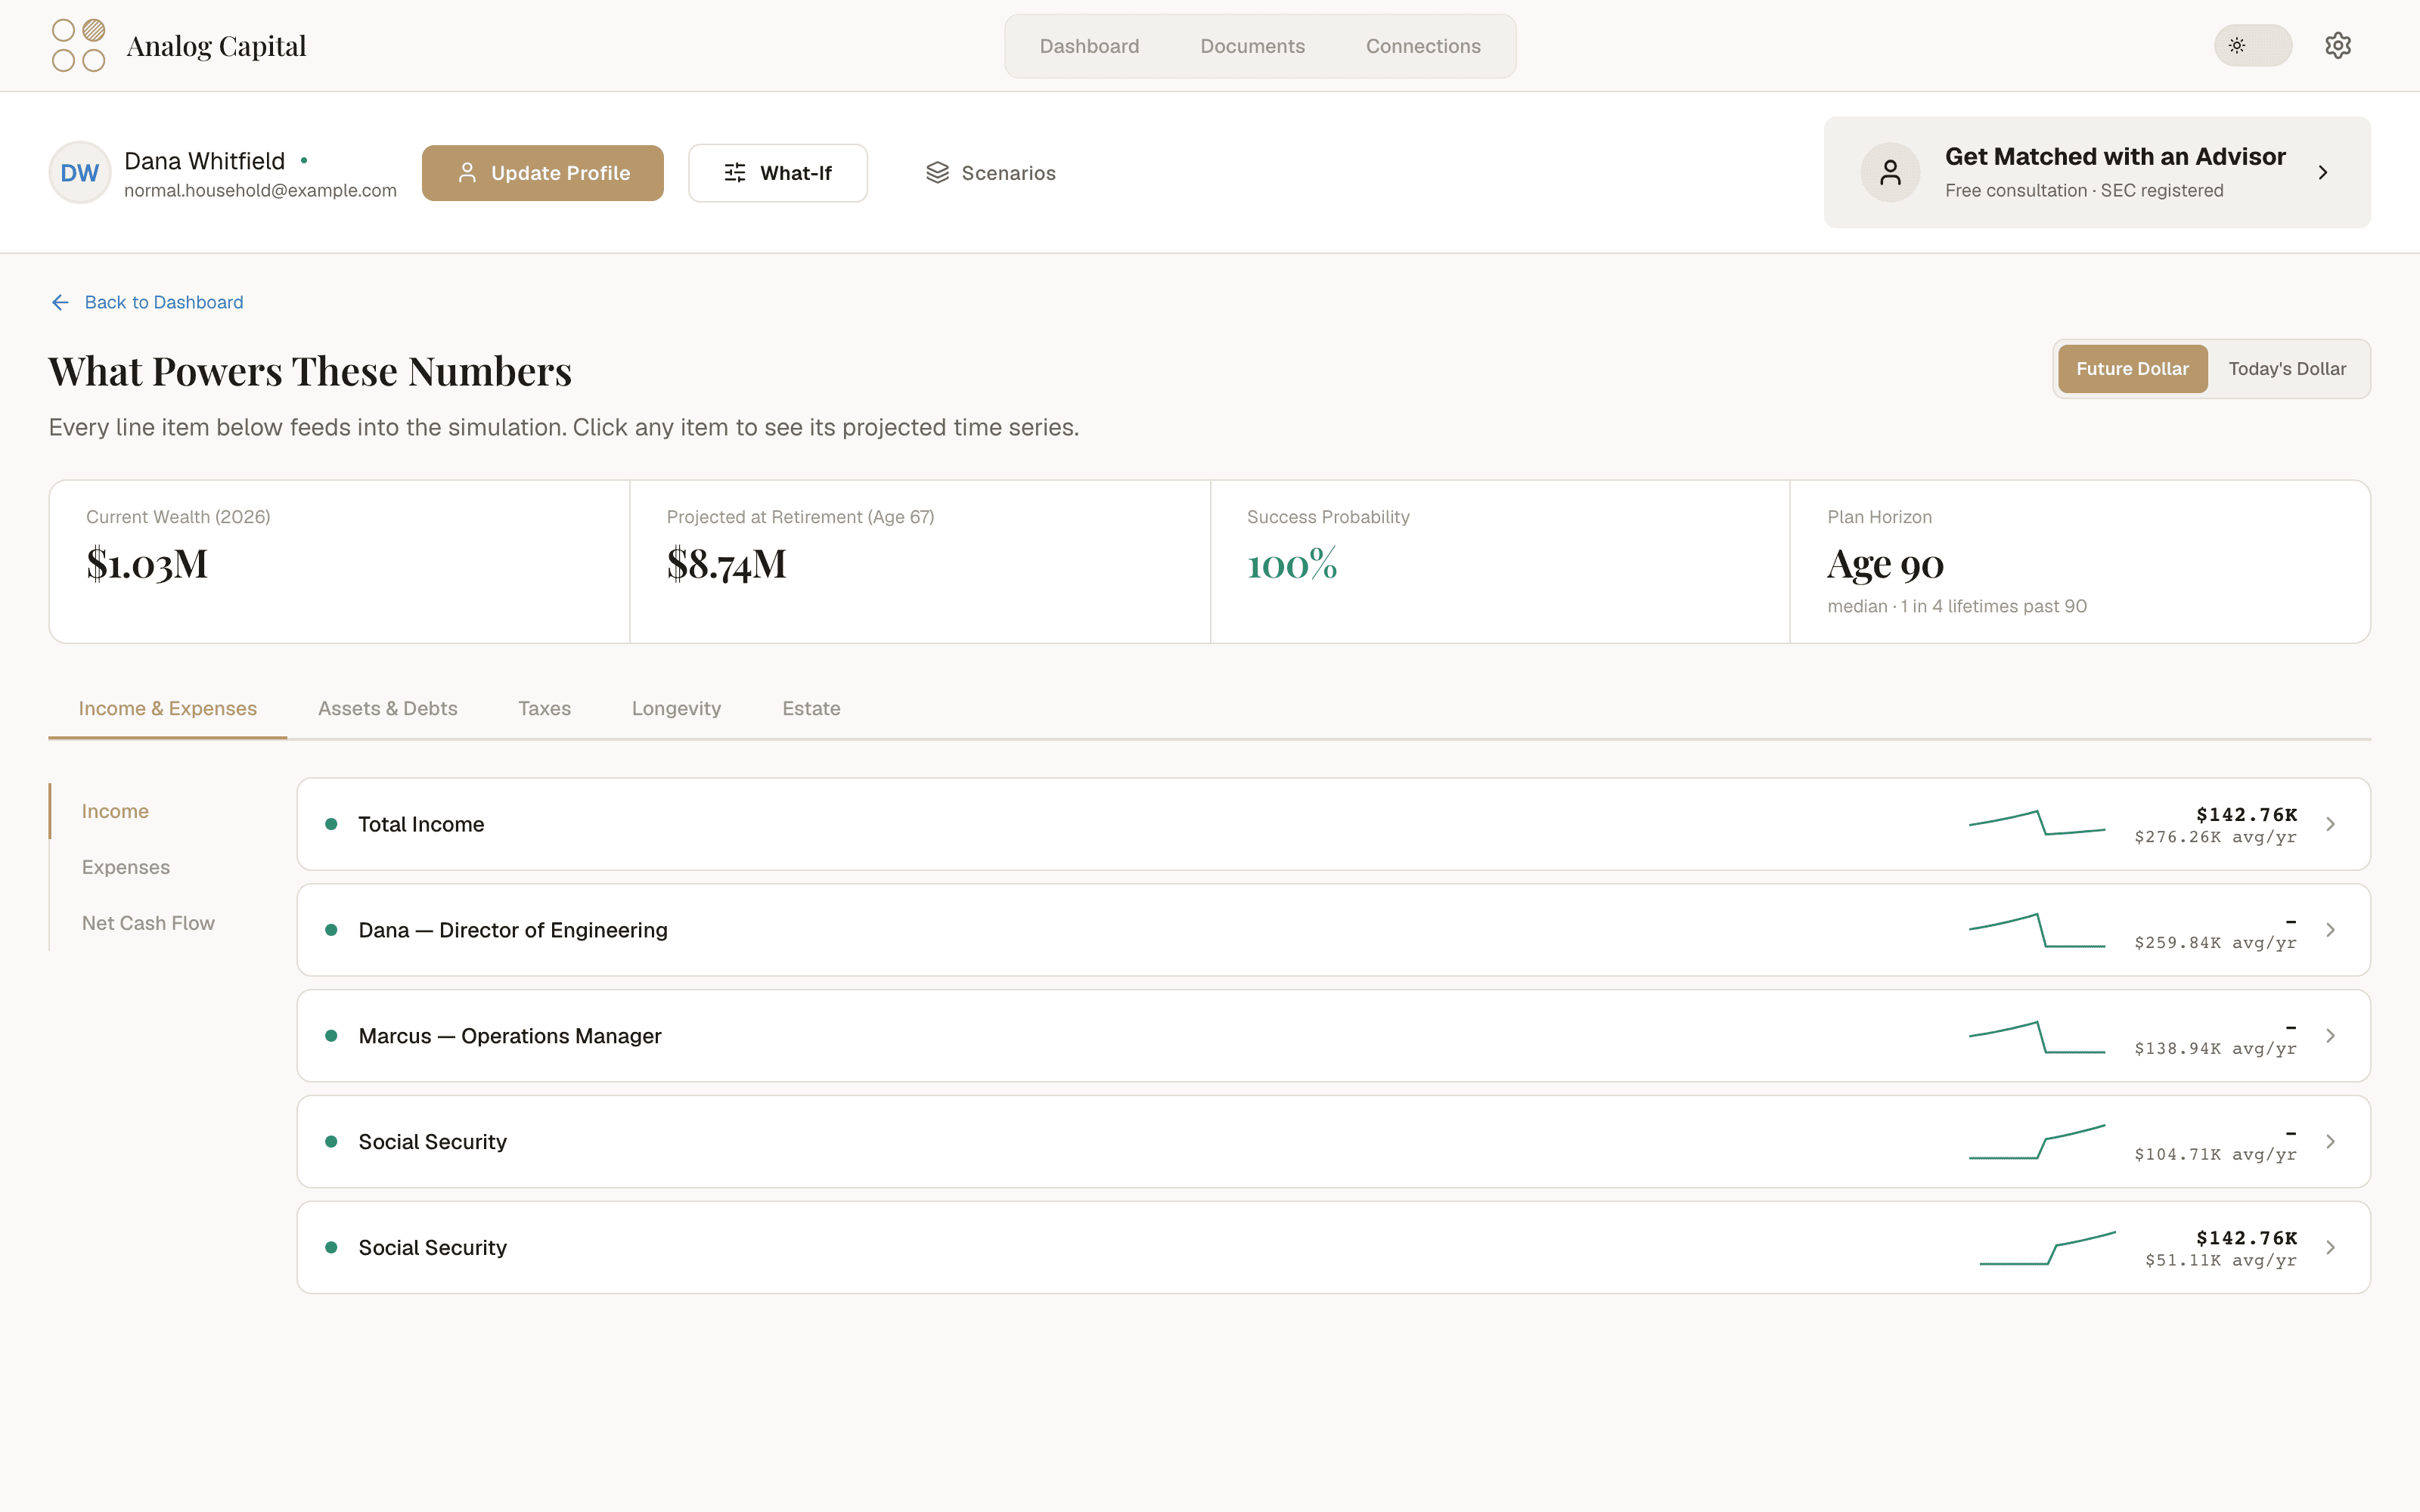
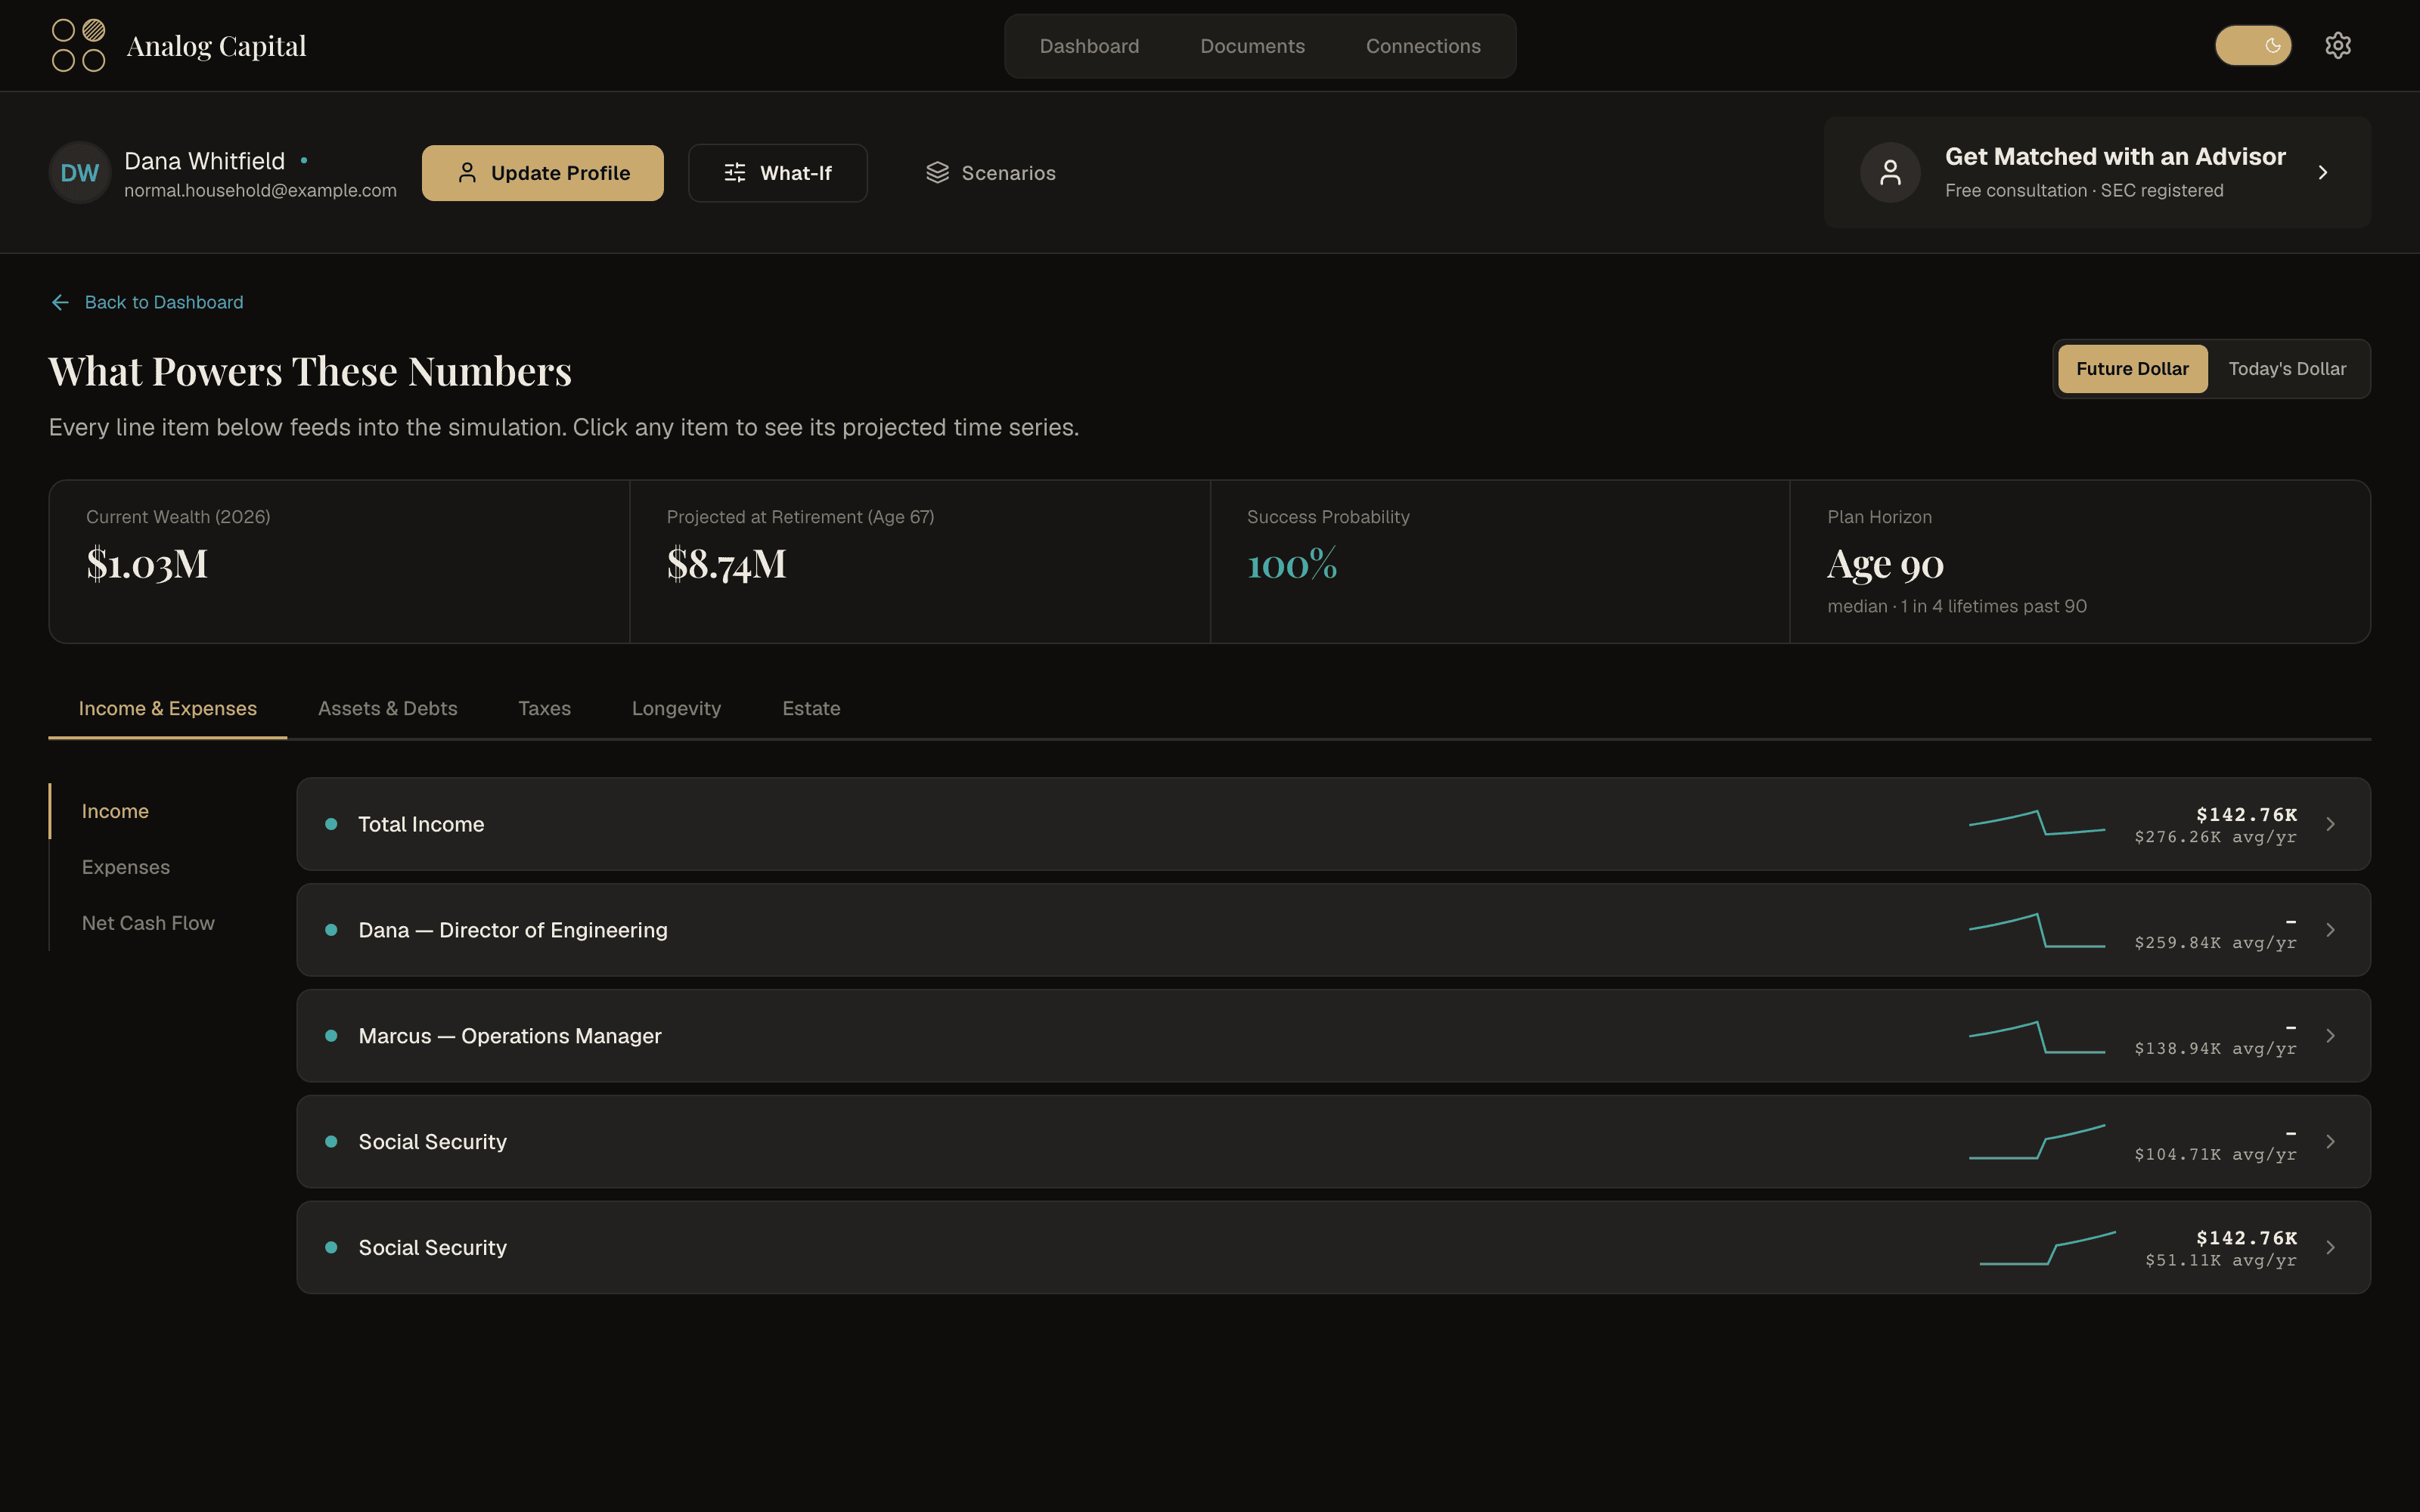
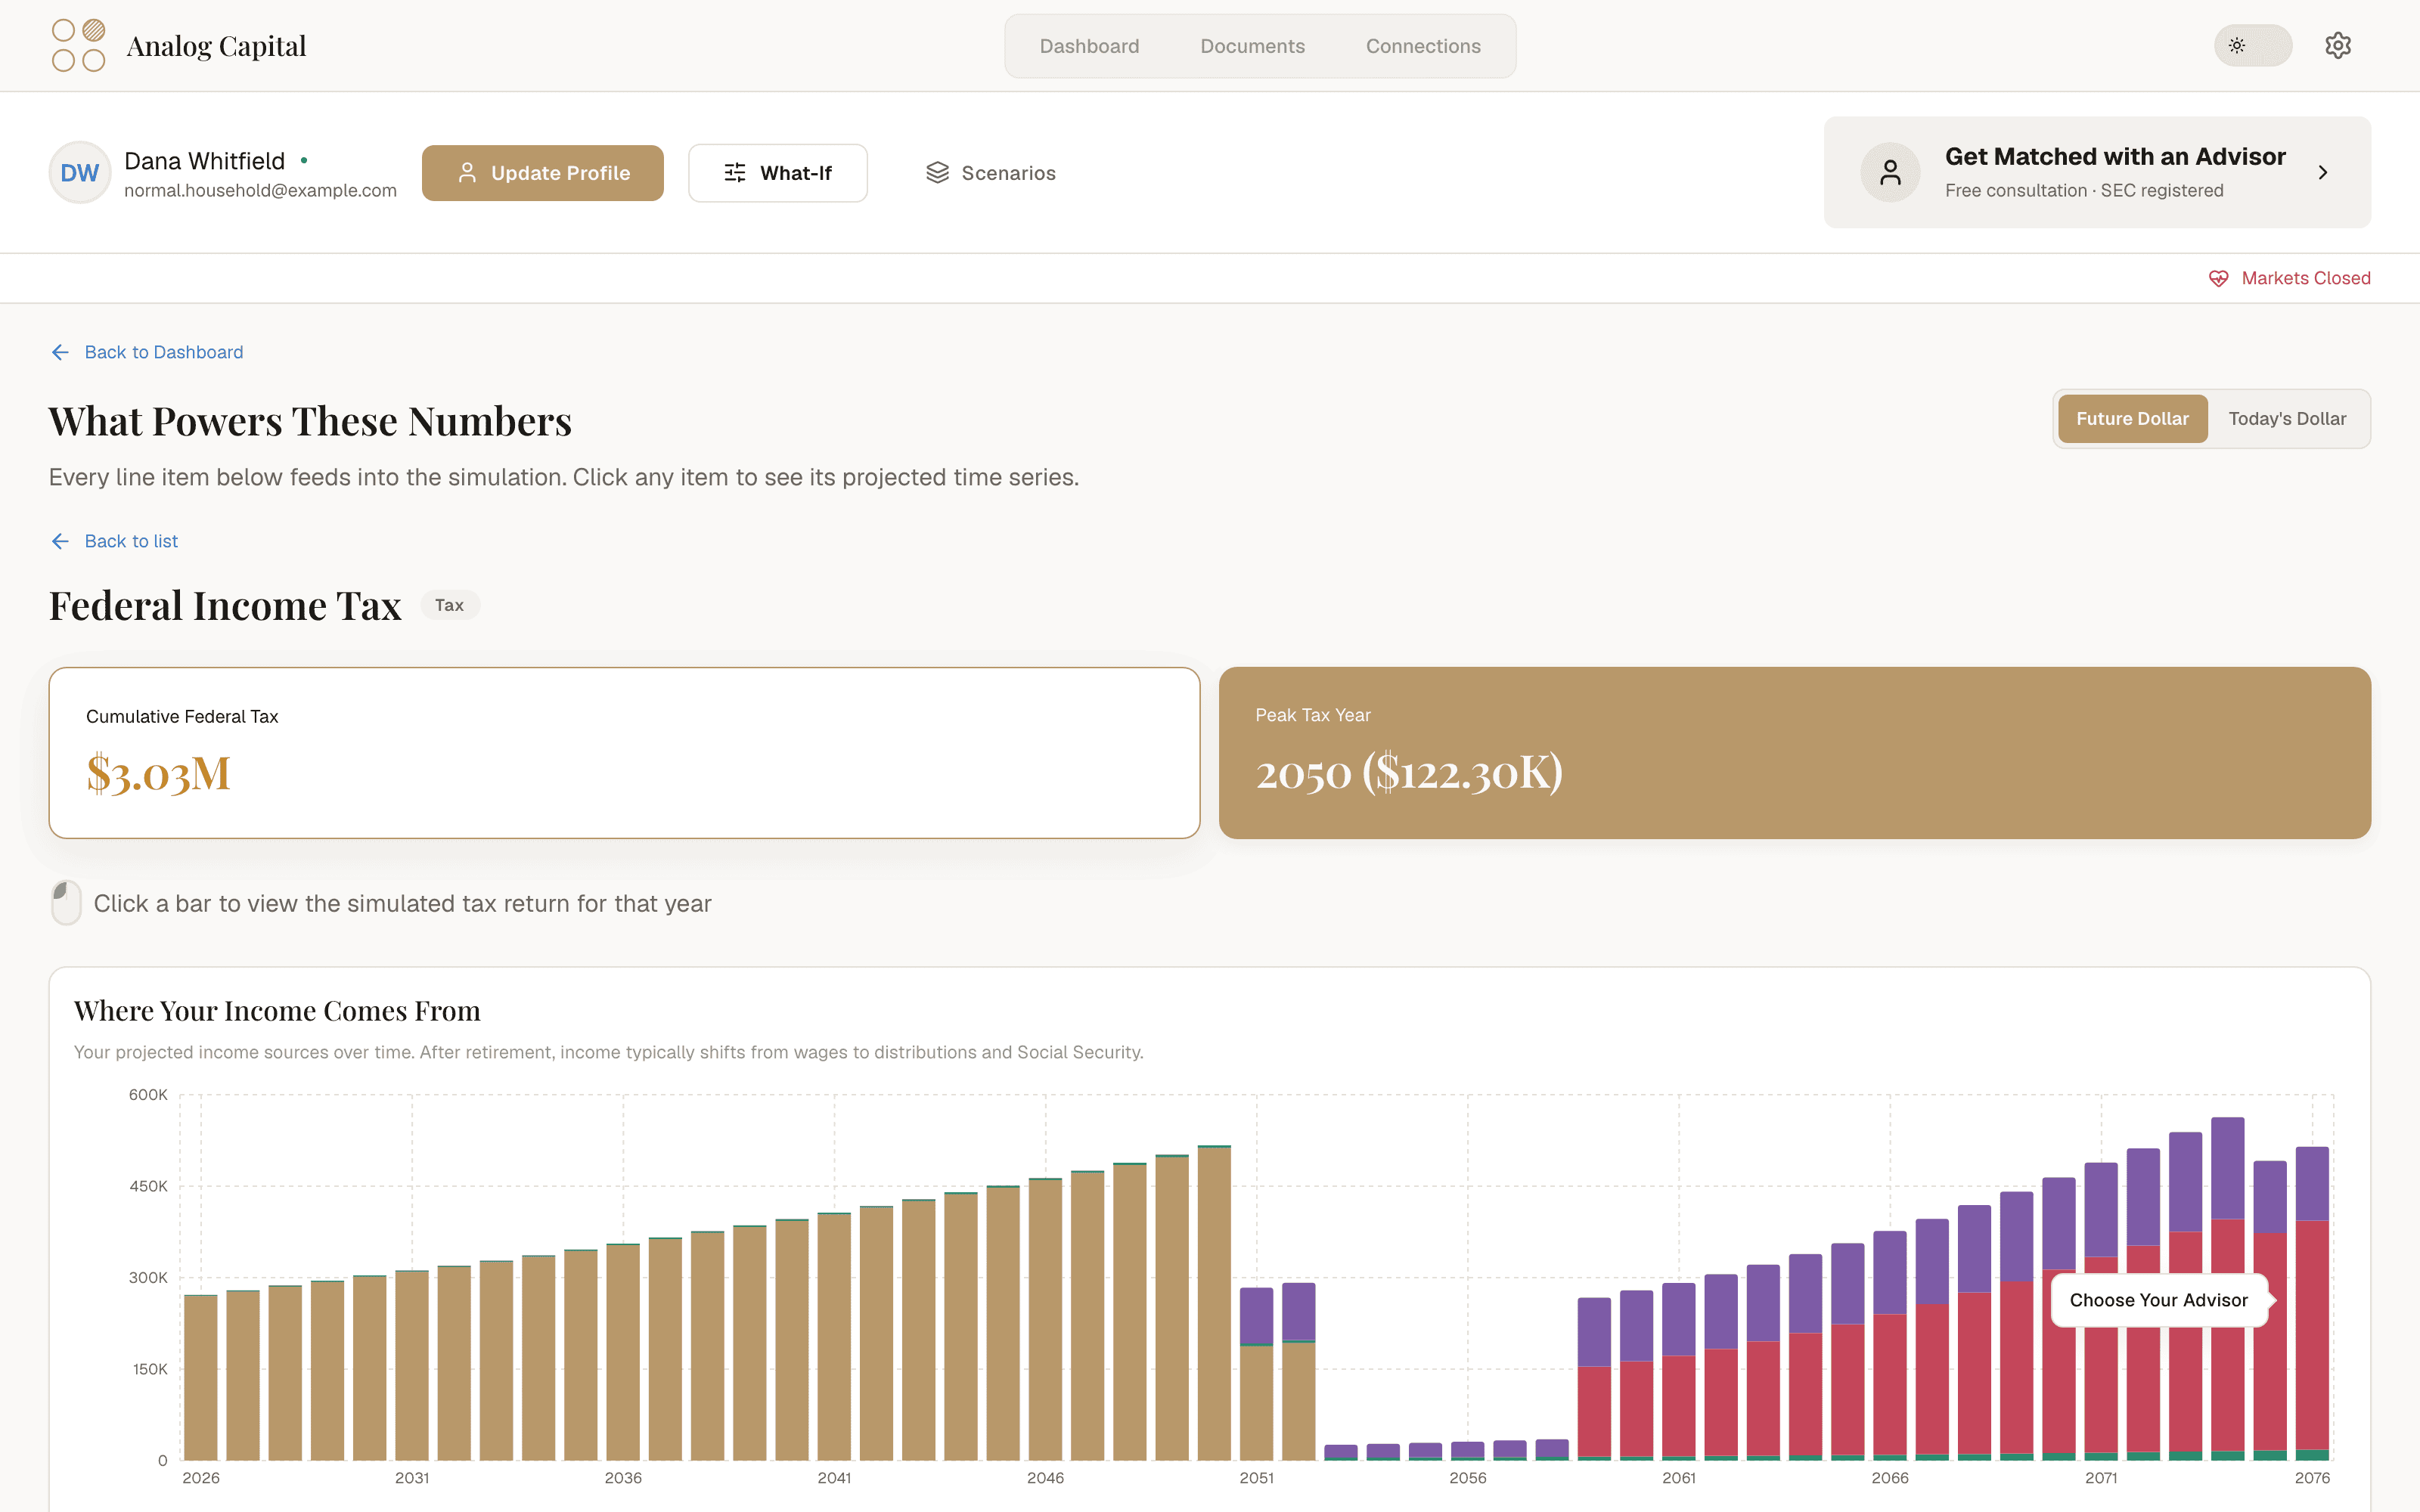
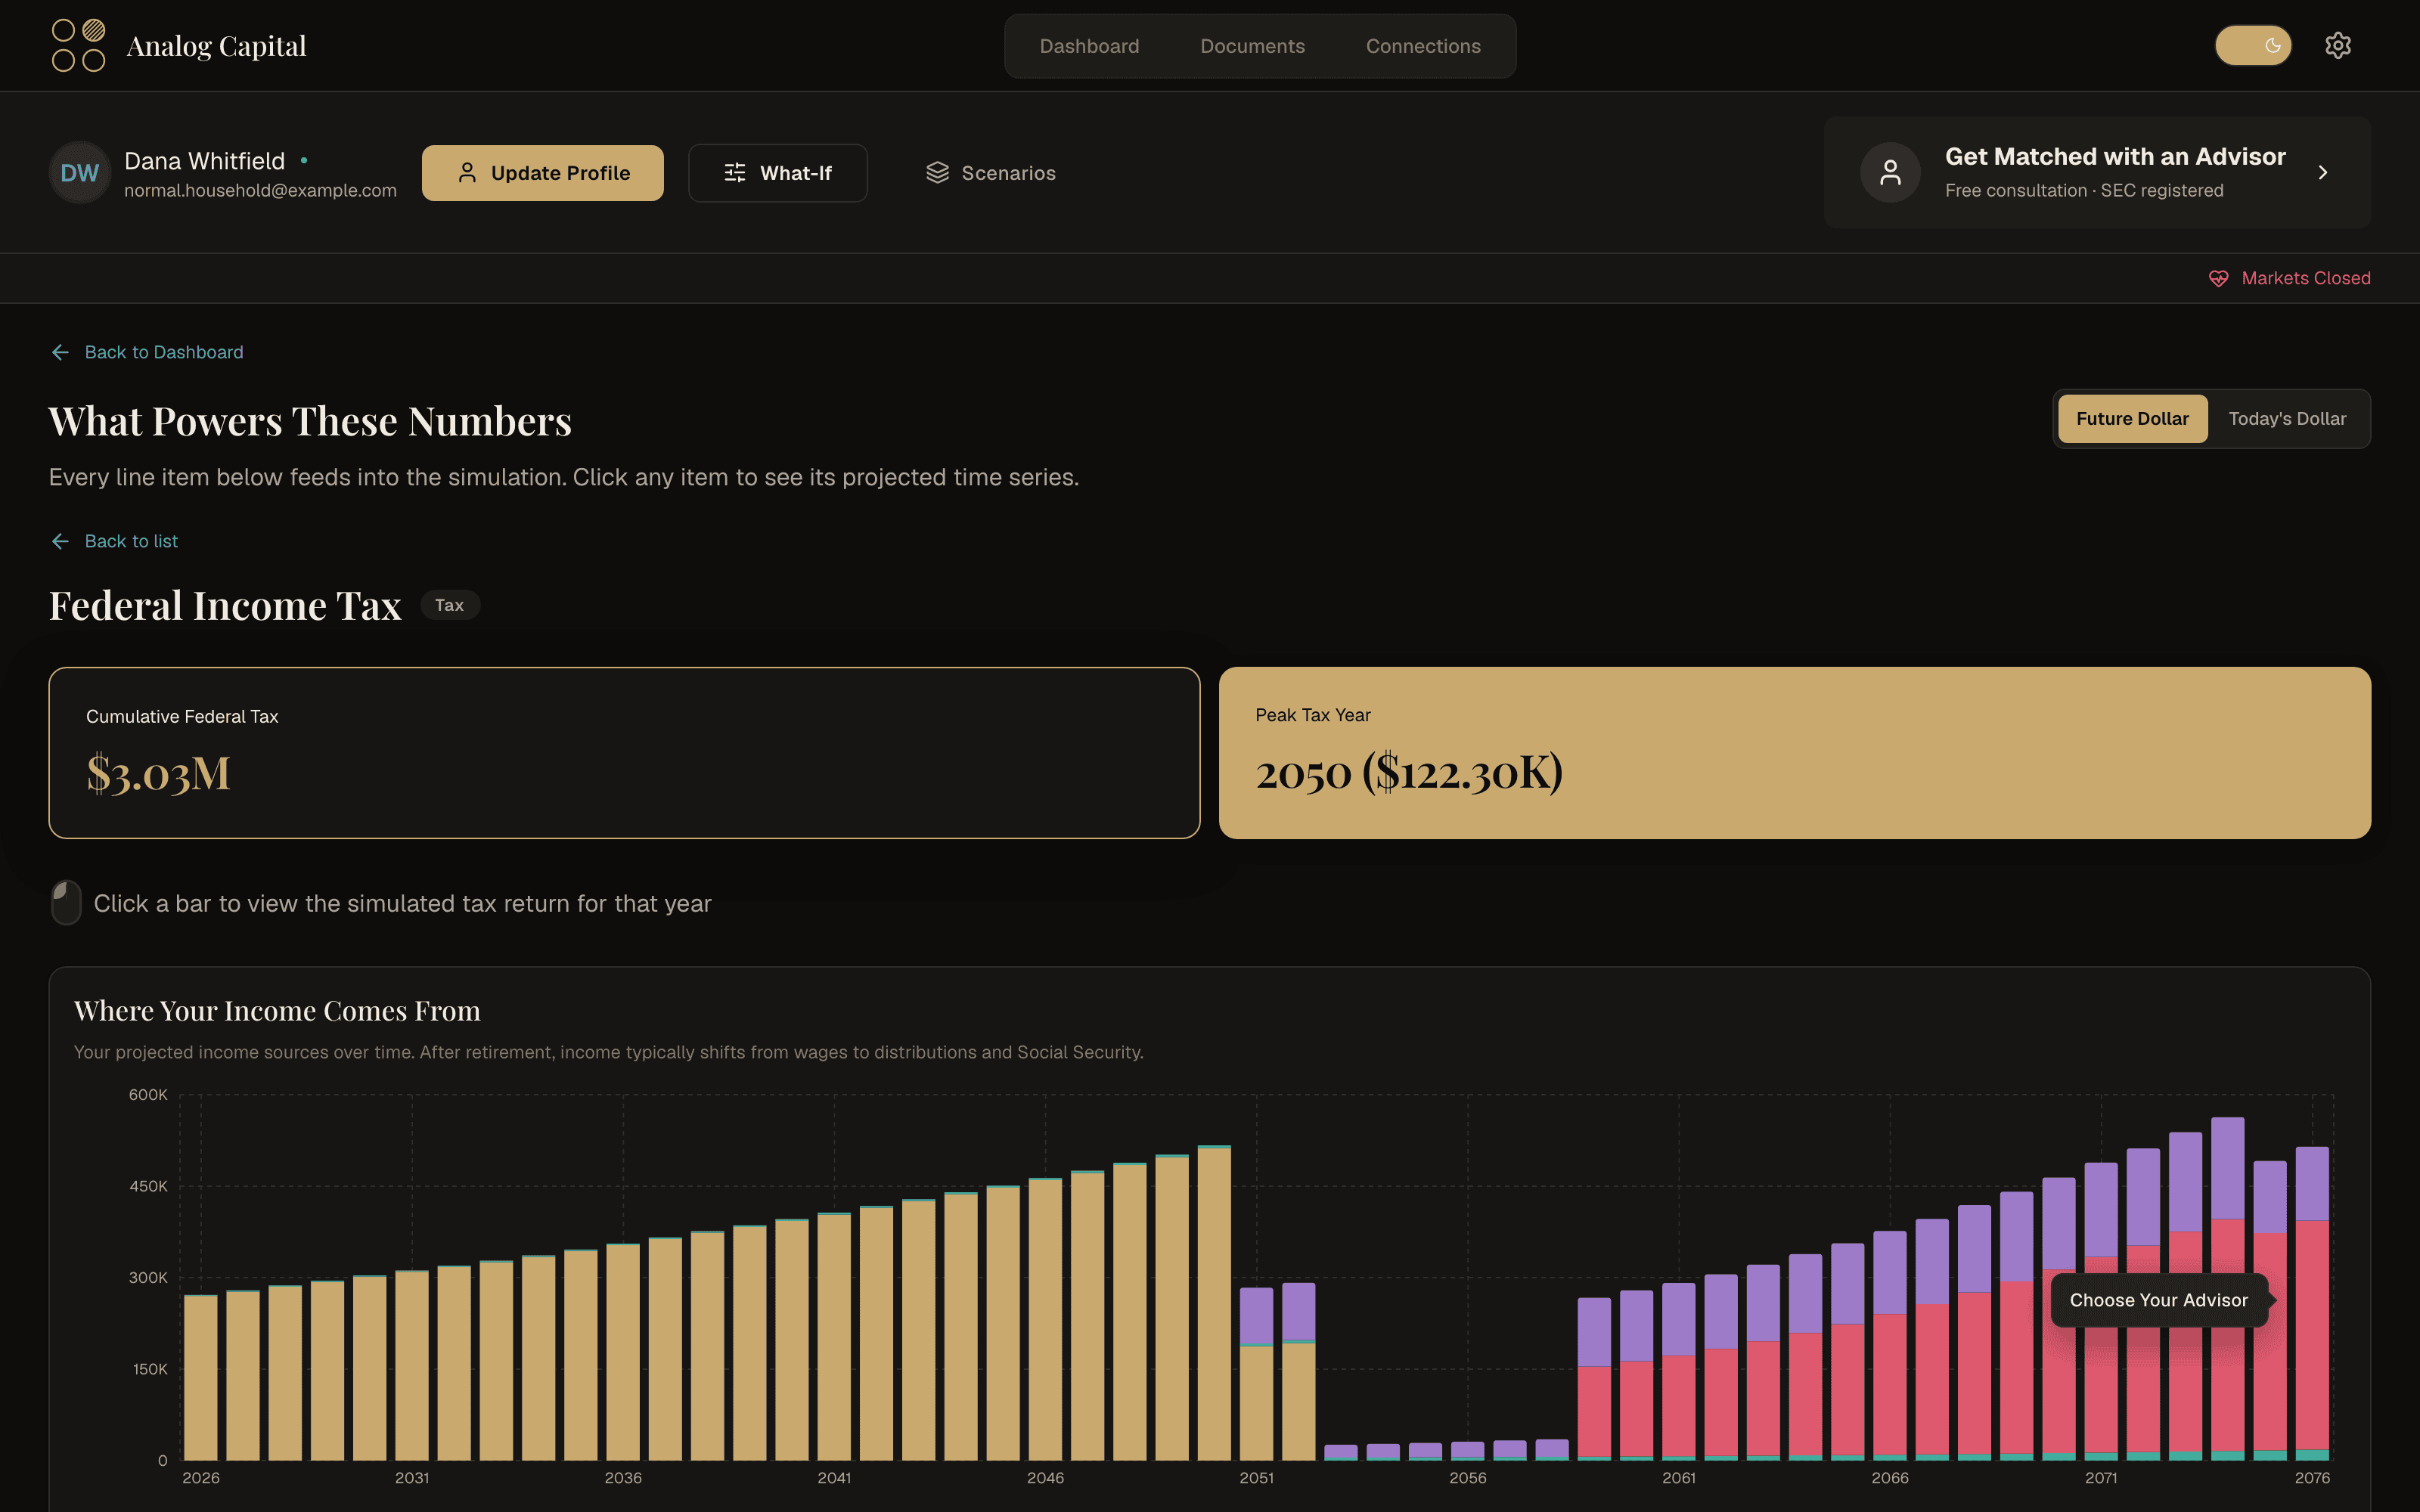
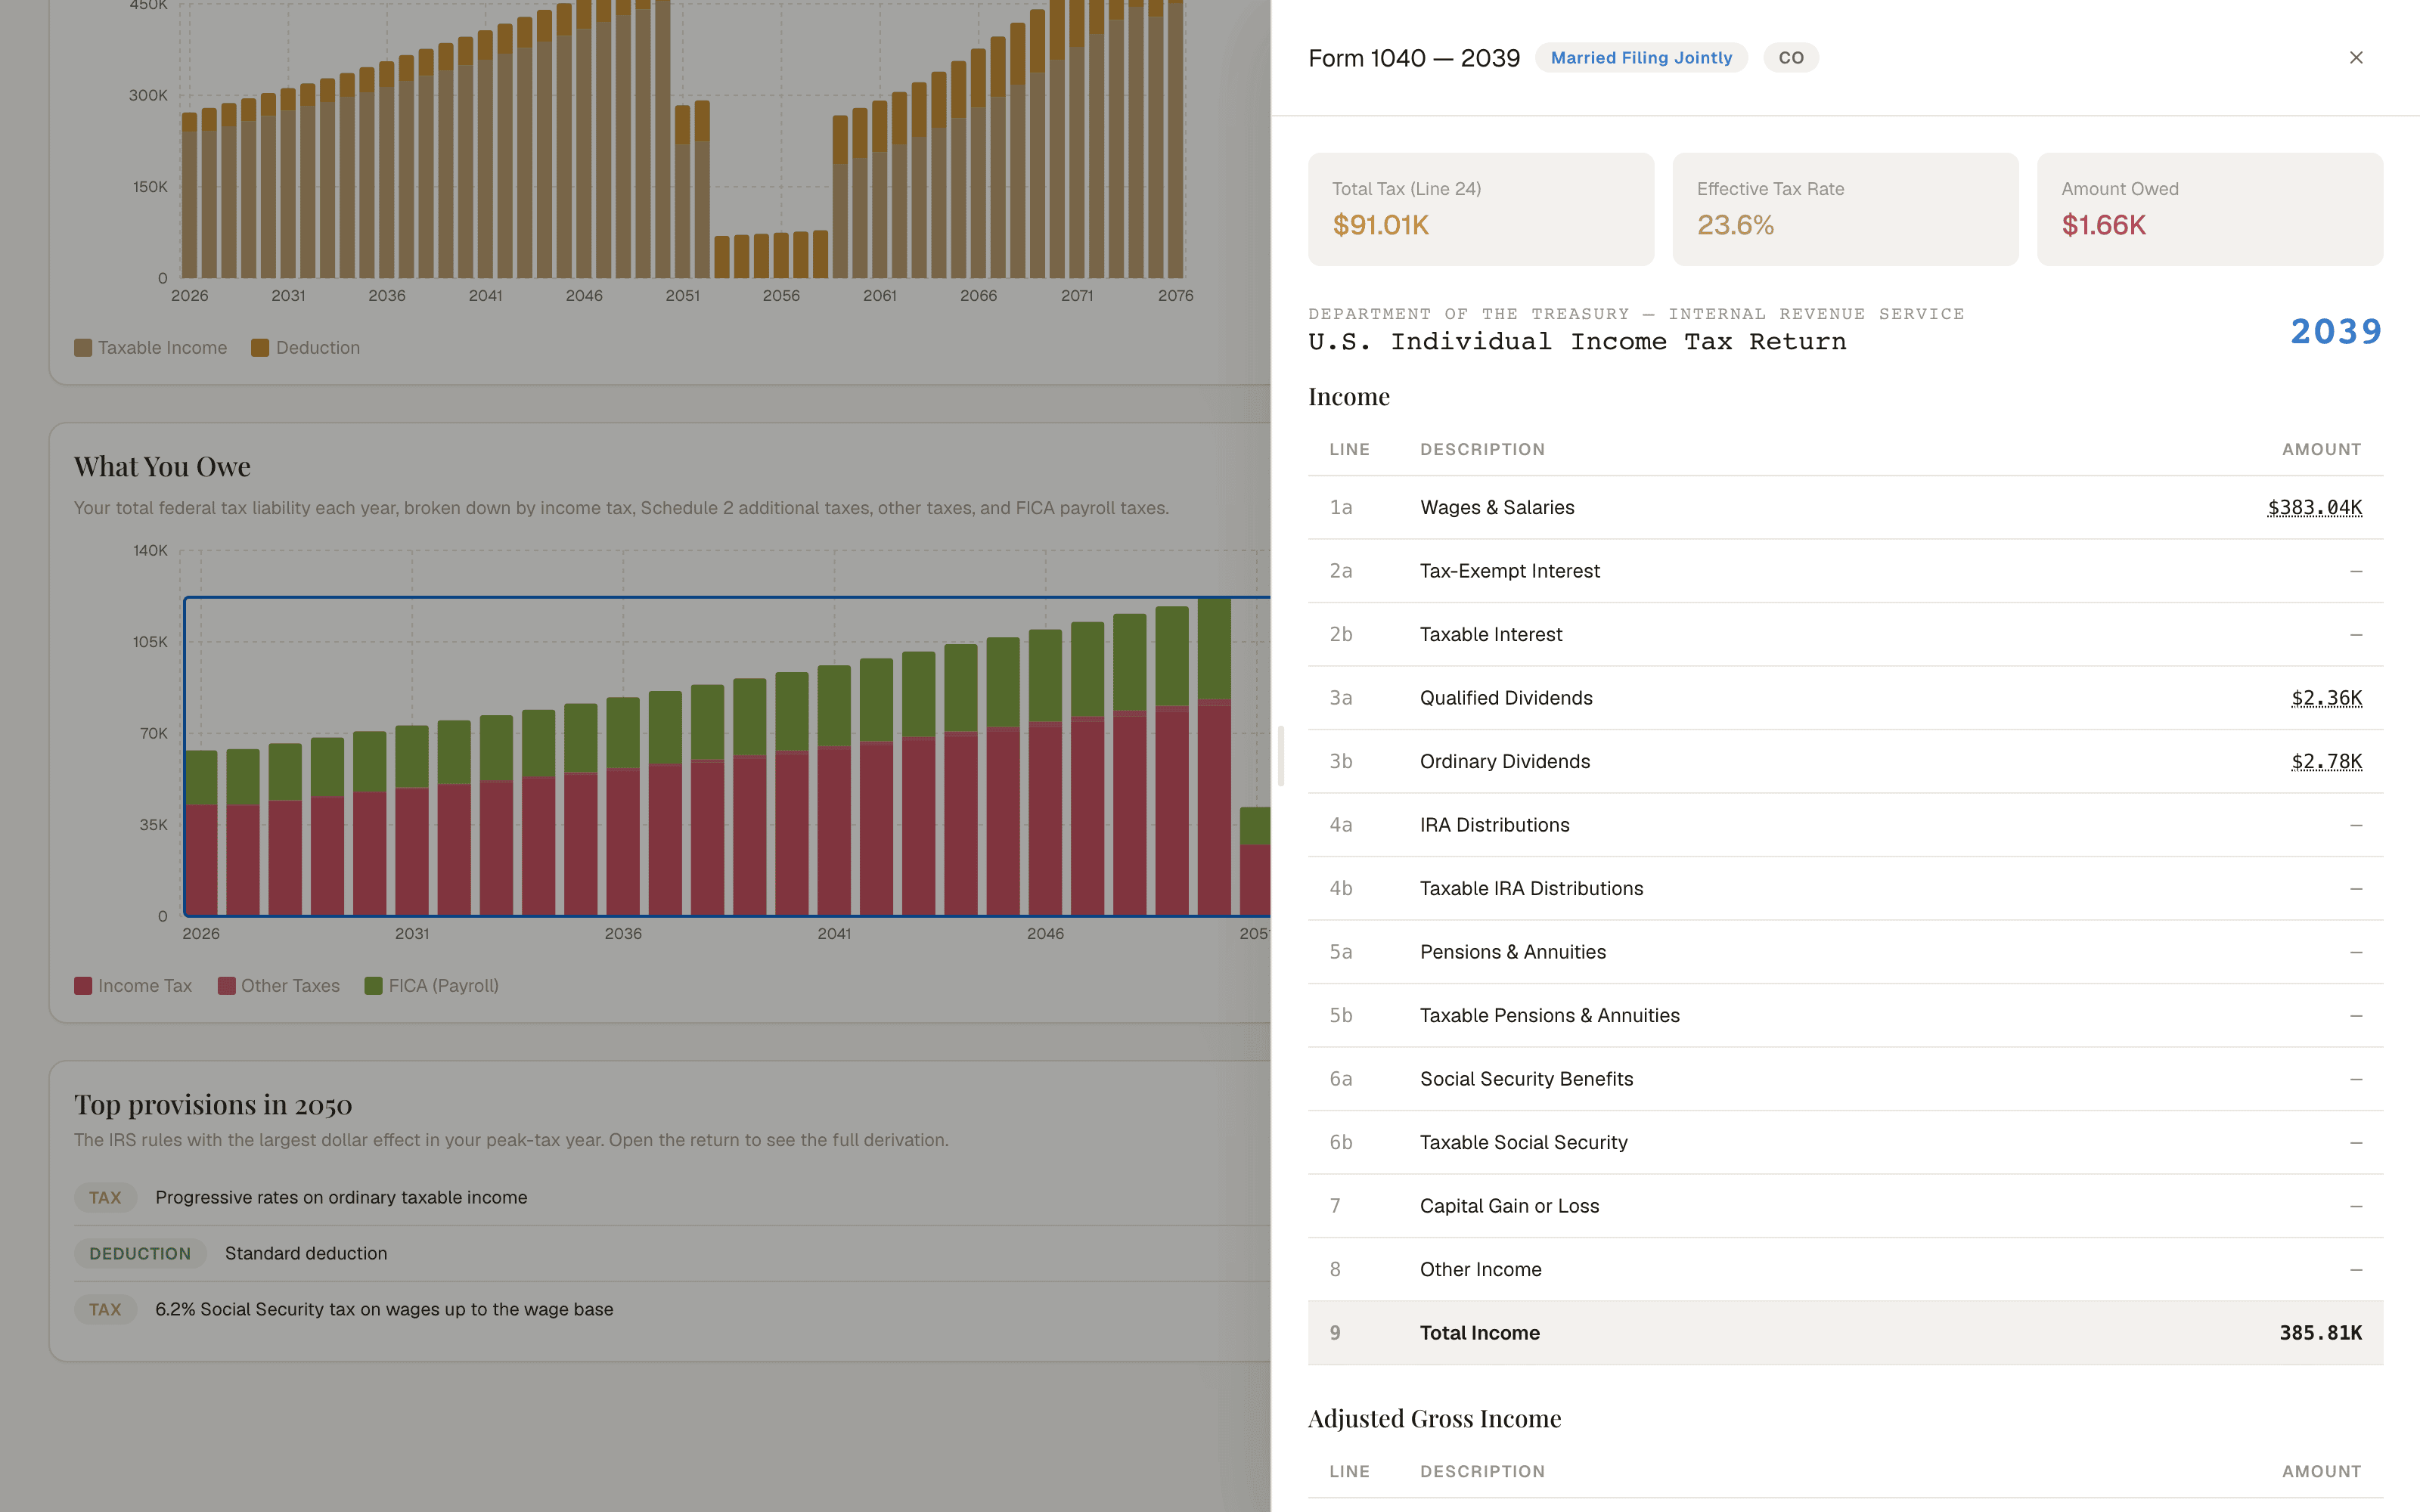
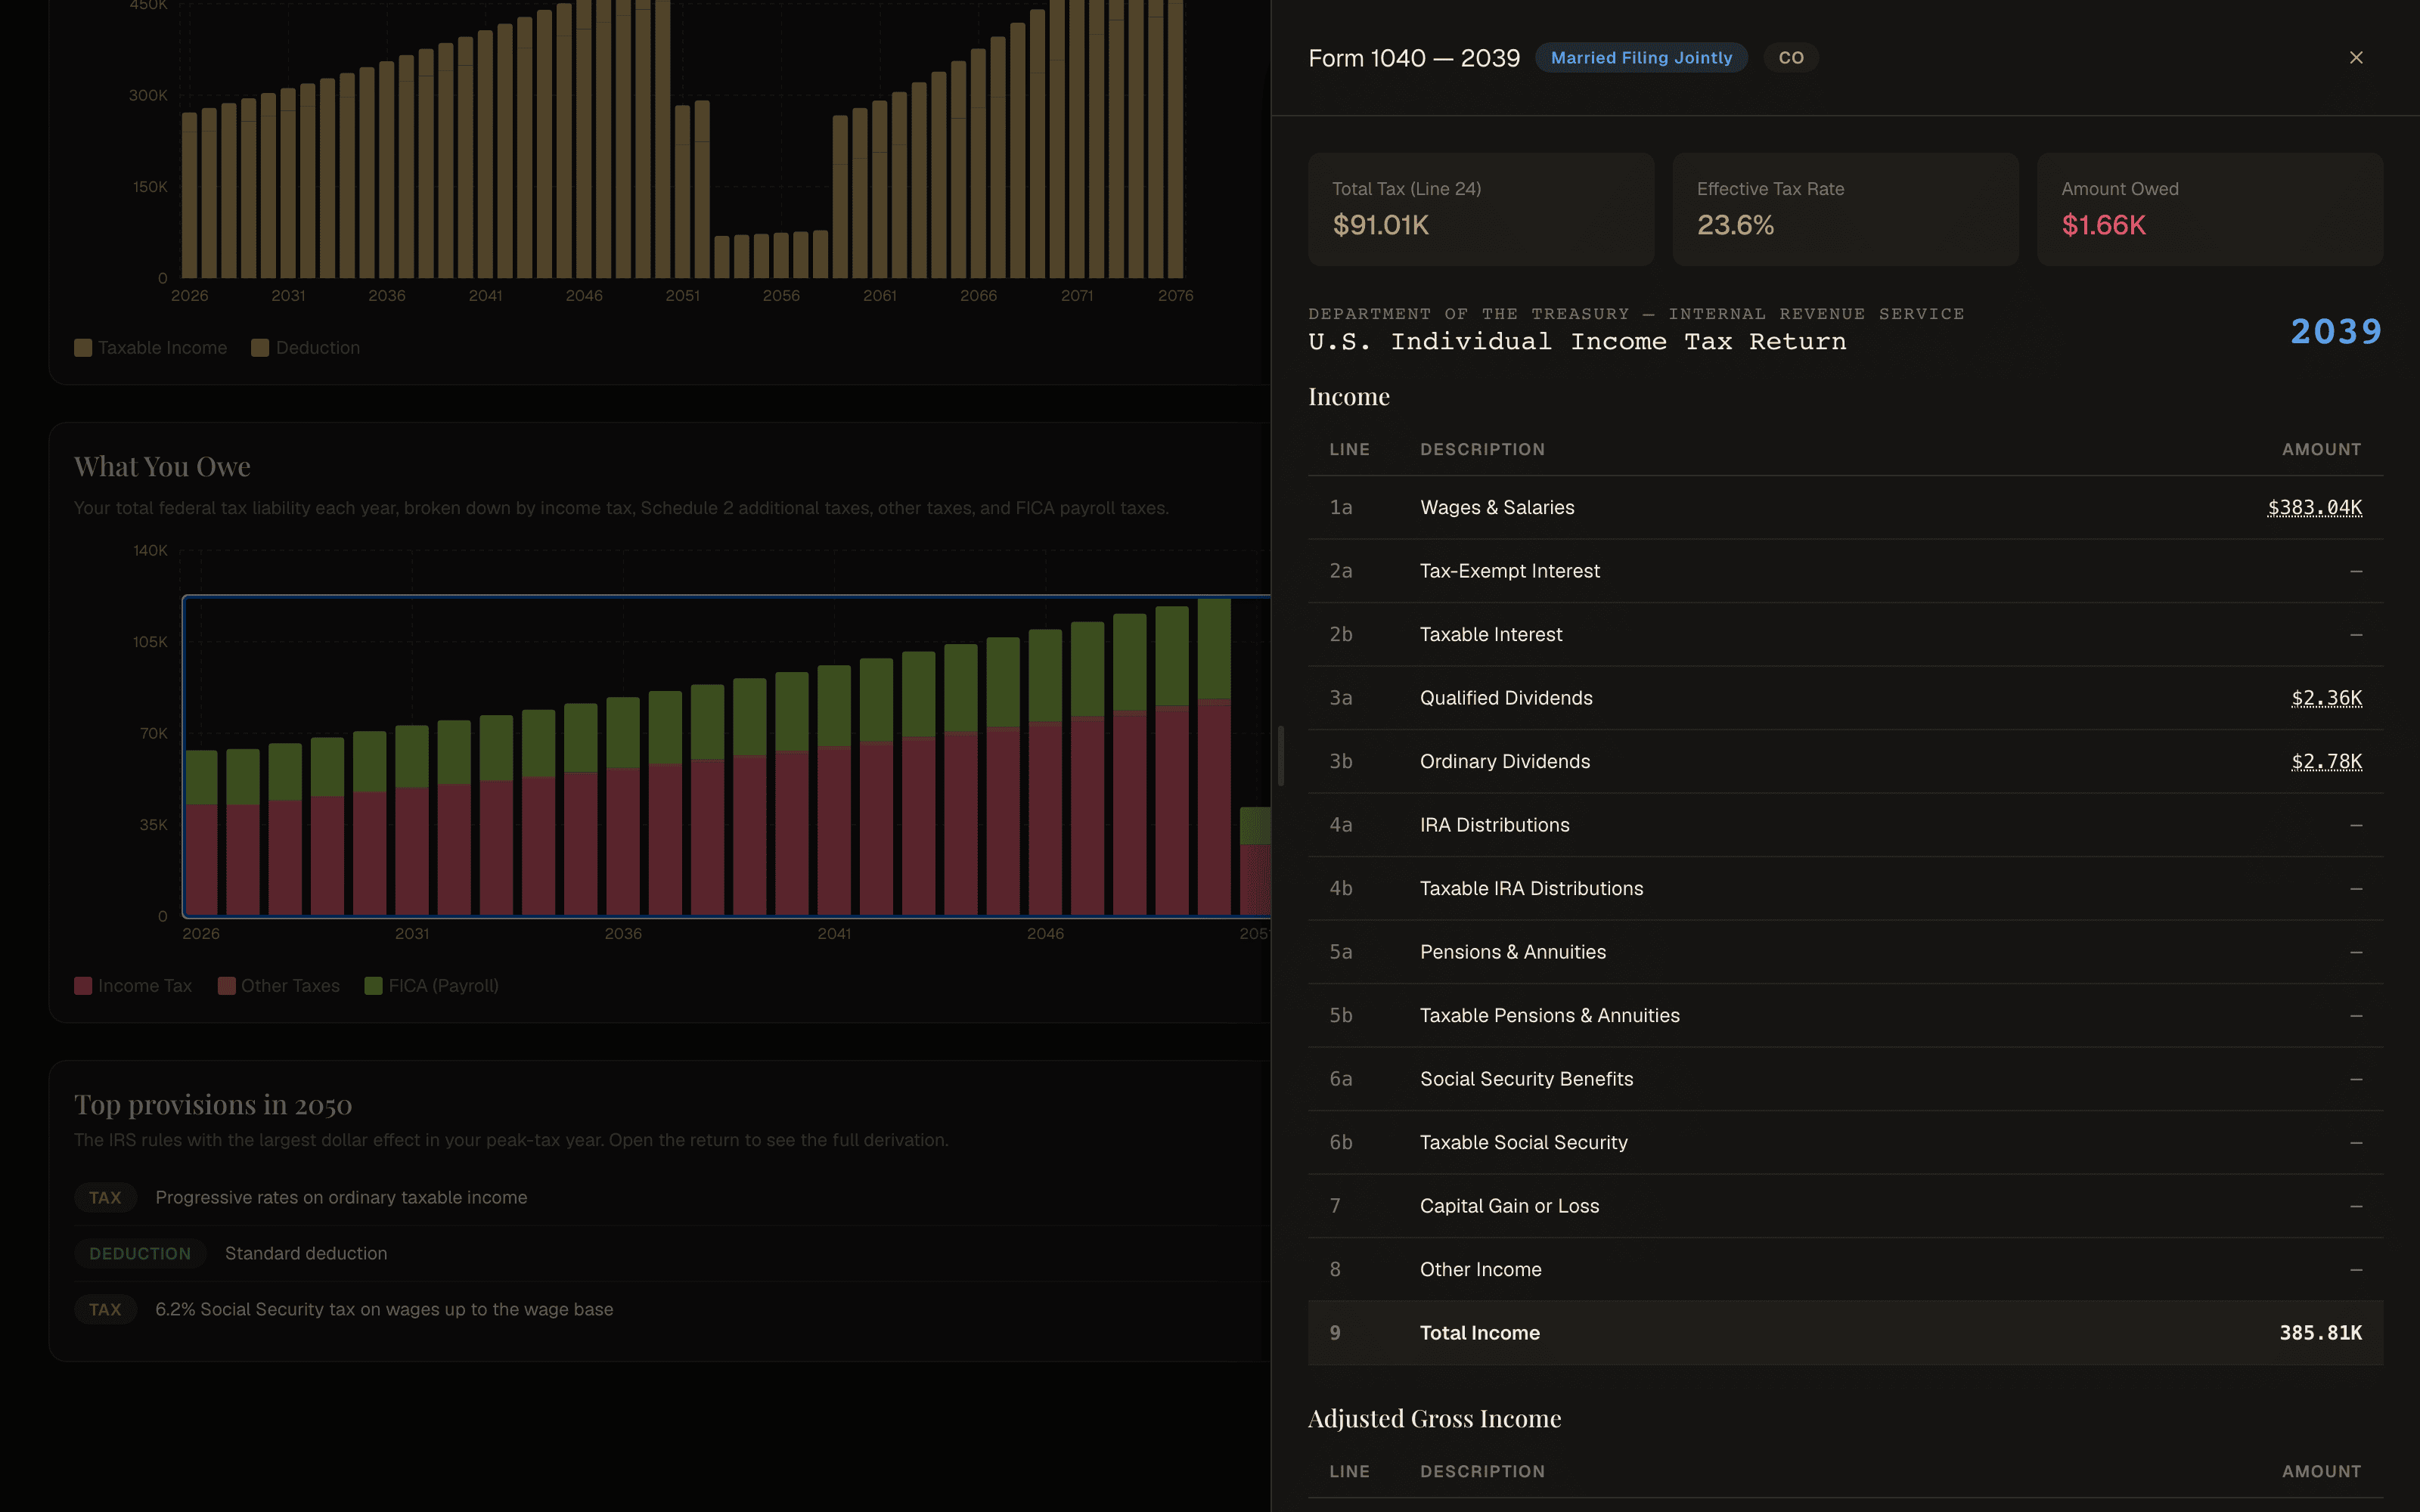
A score you are asked to trust is not an answer. Here, every figure opens. Start at your whole plan, descend into any year’s tax, and keep going — down to the simulated tax form for that year, line by line, and the transactions behind each line. You are never asked to take a number on faith.

Shown: a sample household, built with fictional data.

The assistant

Not a chat window — it works on the plan itself.

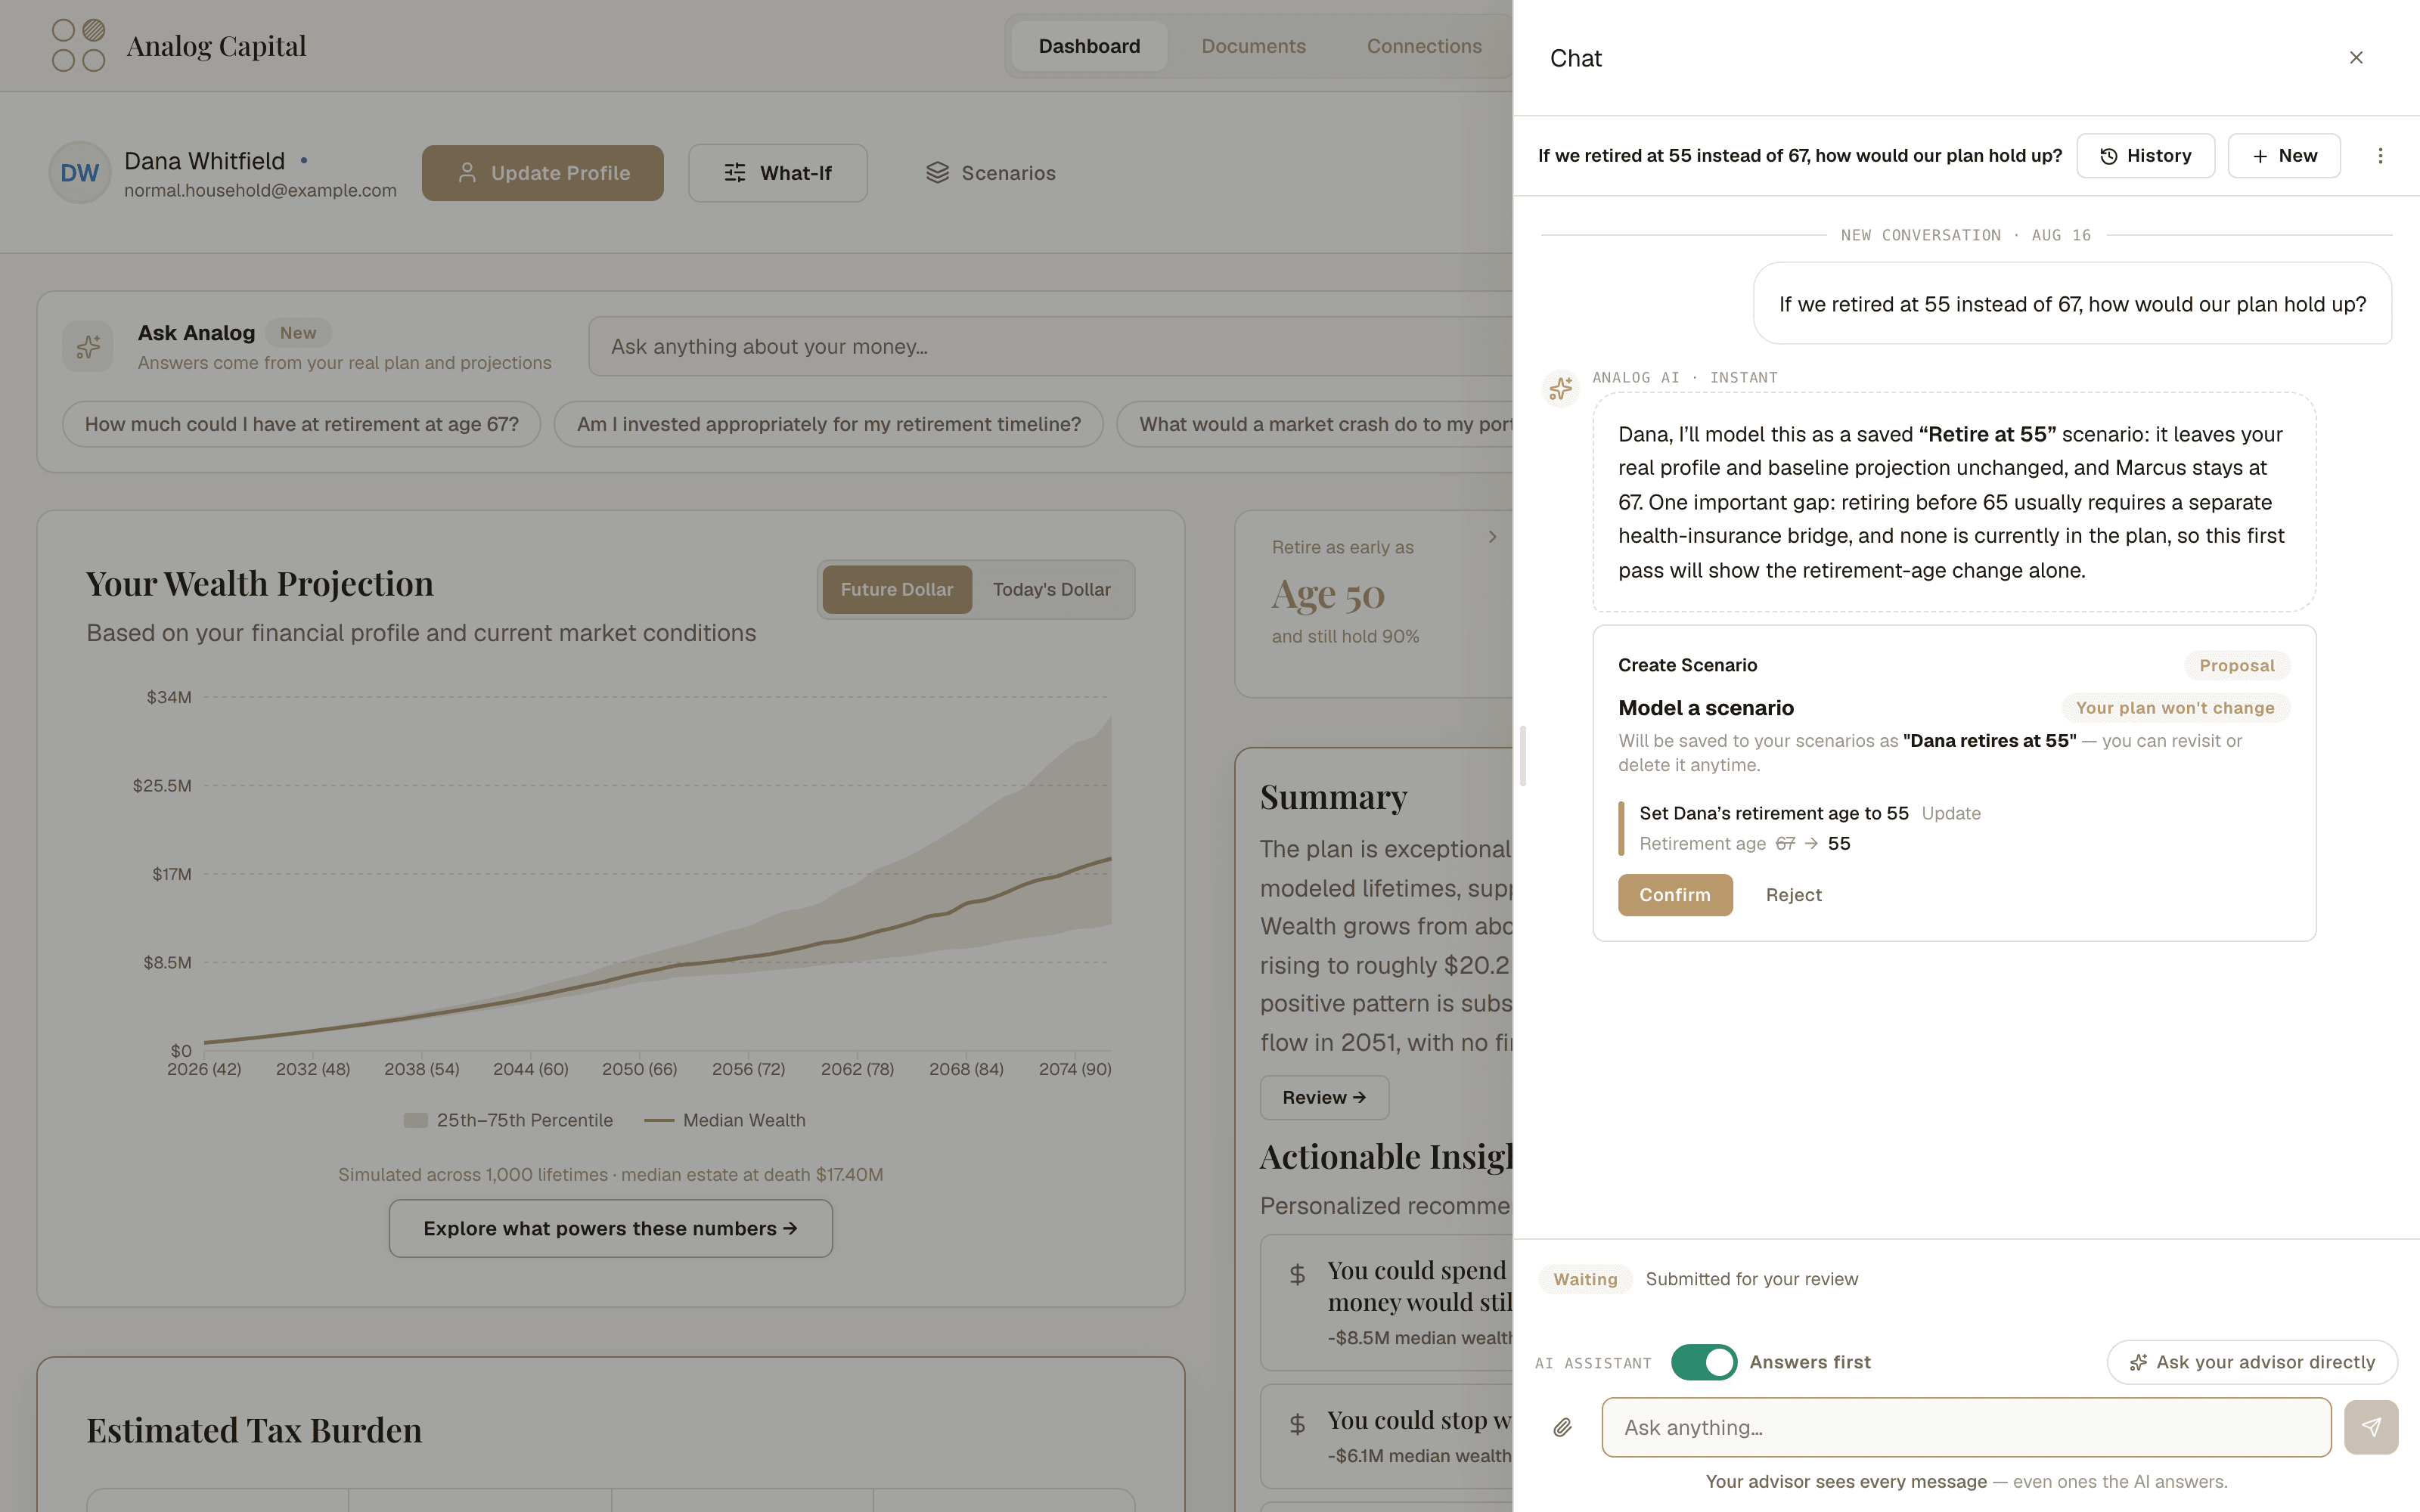
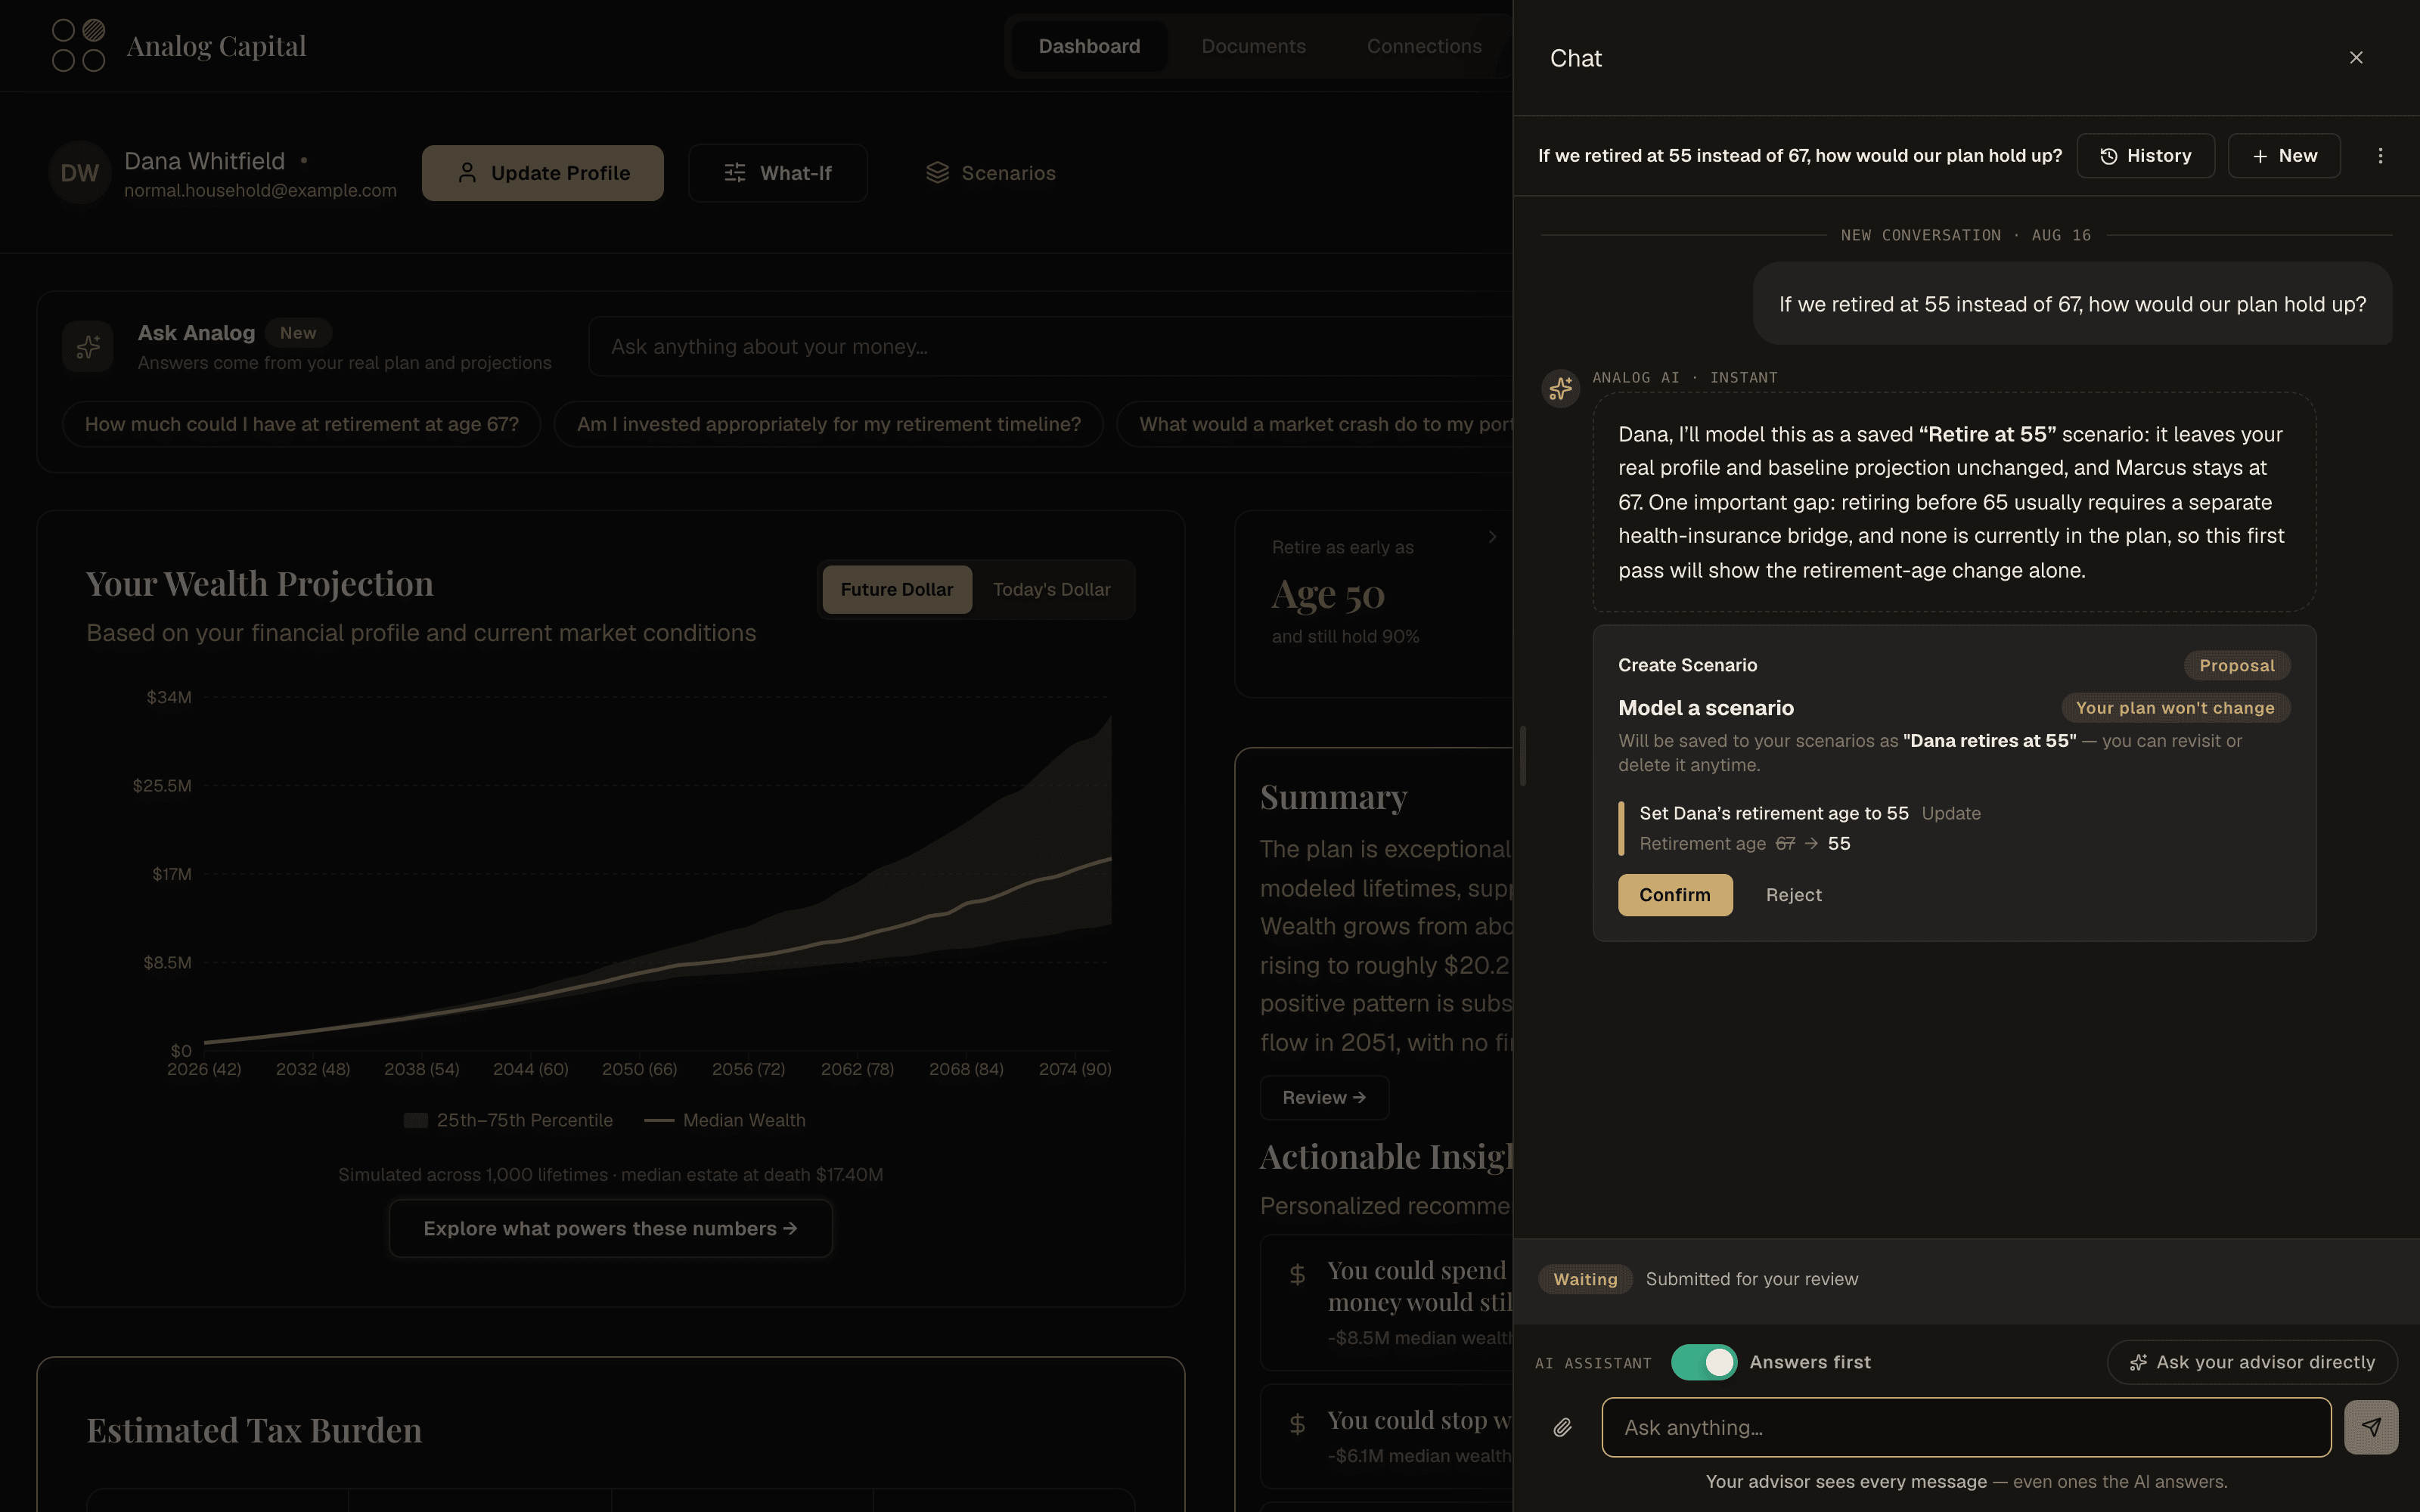
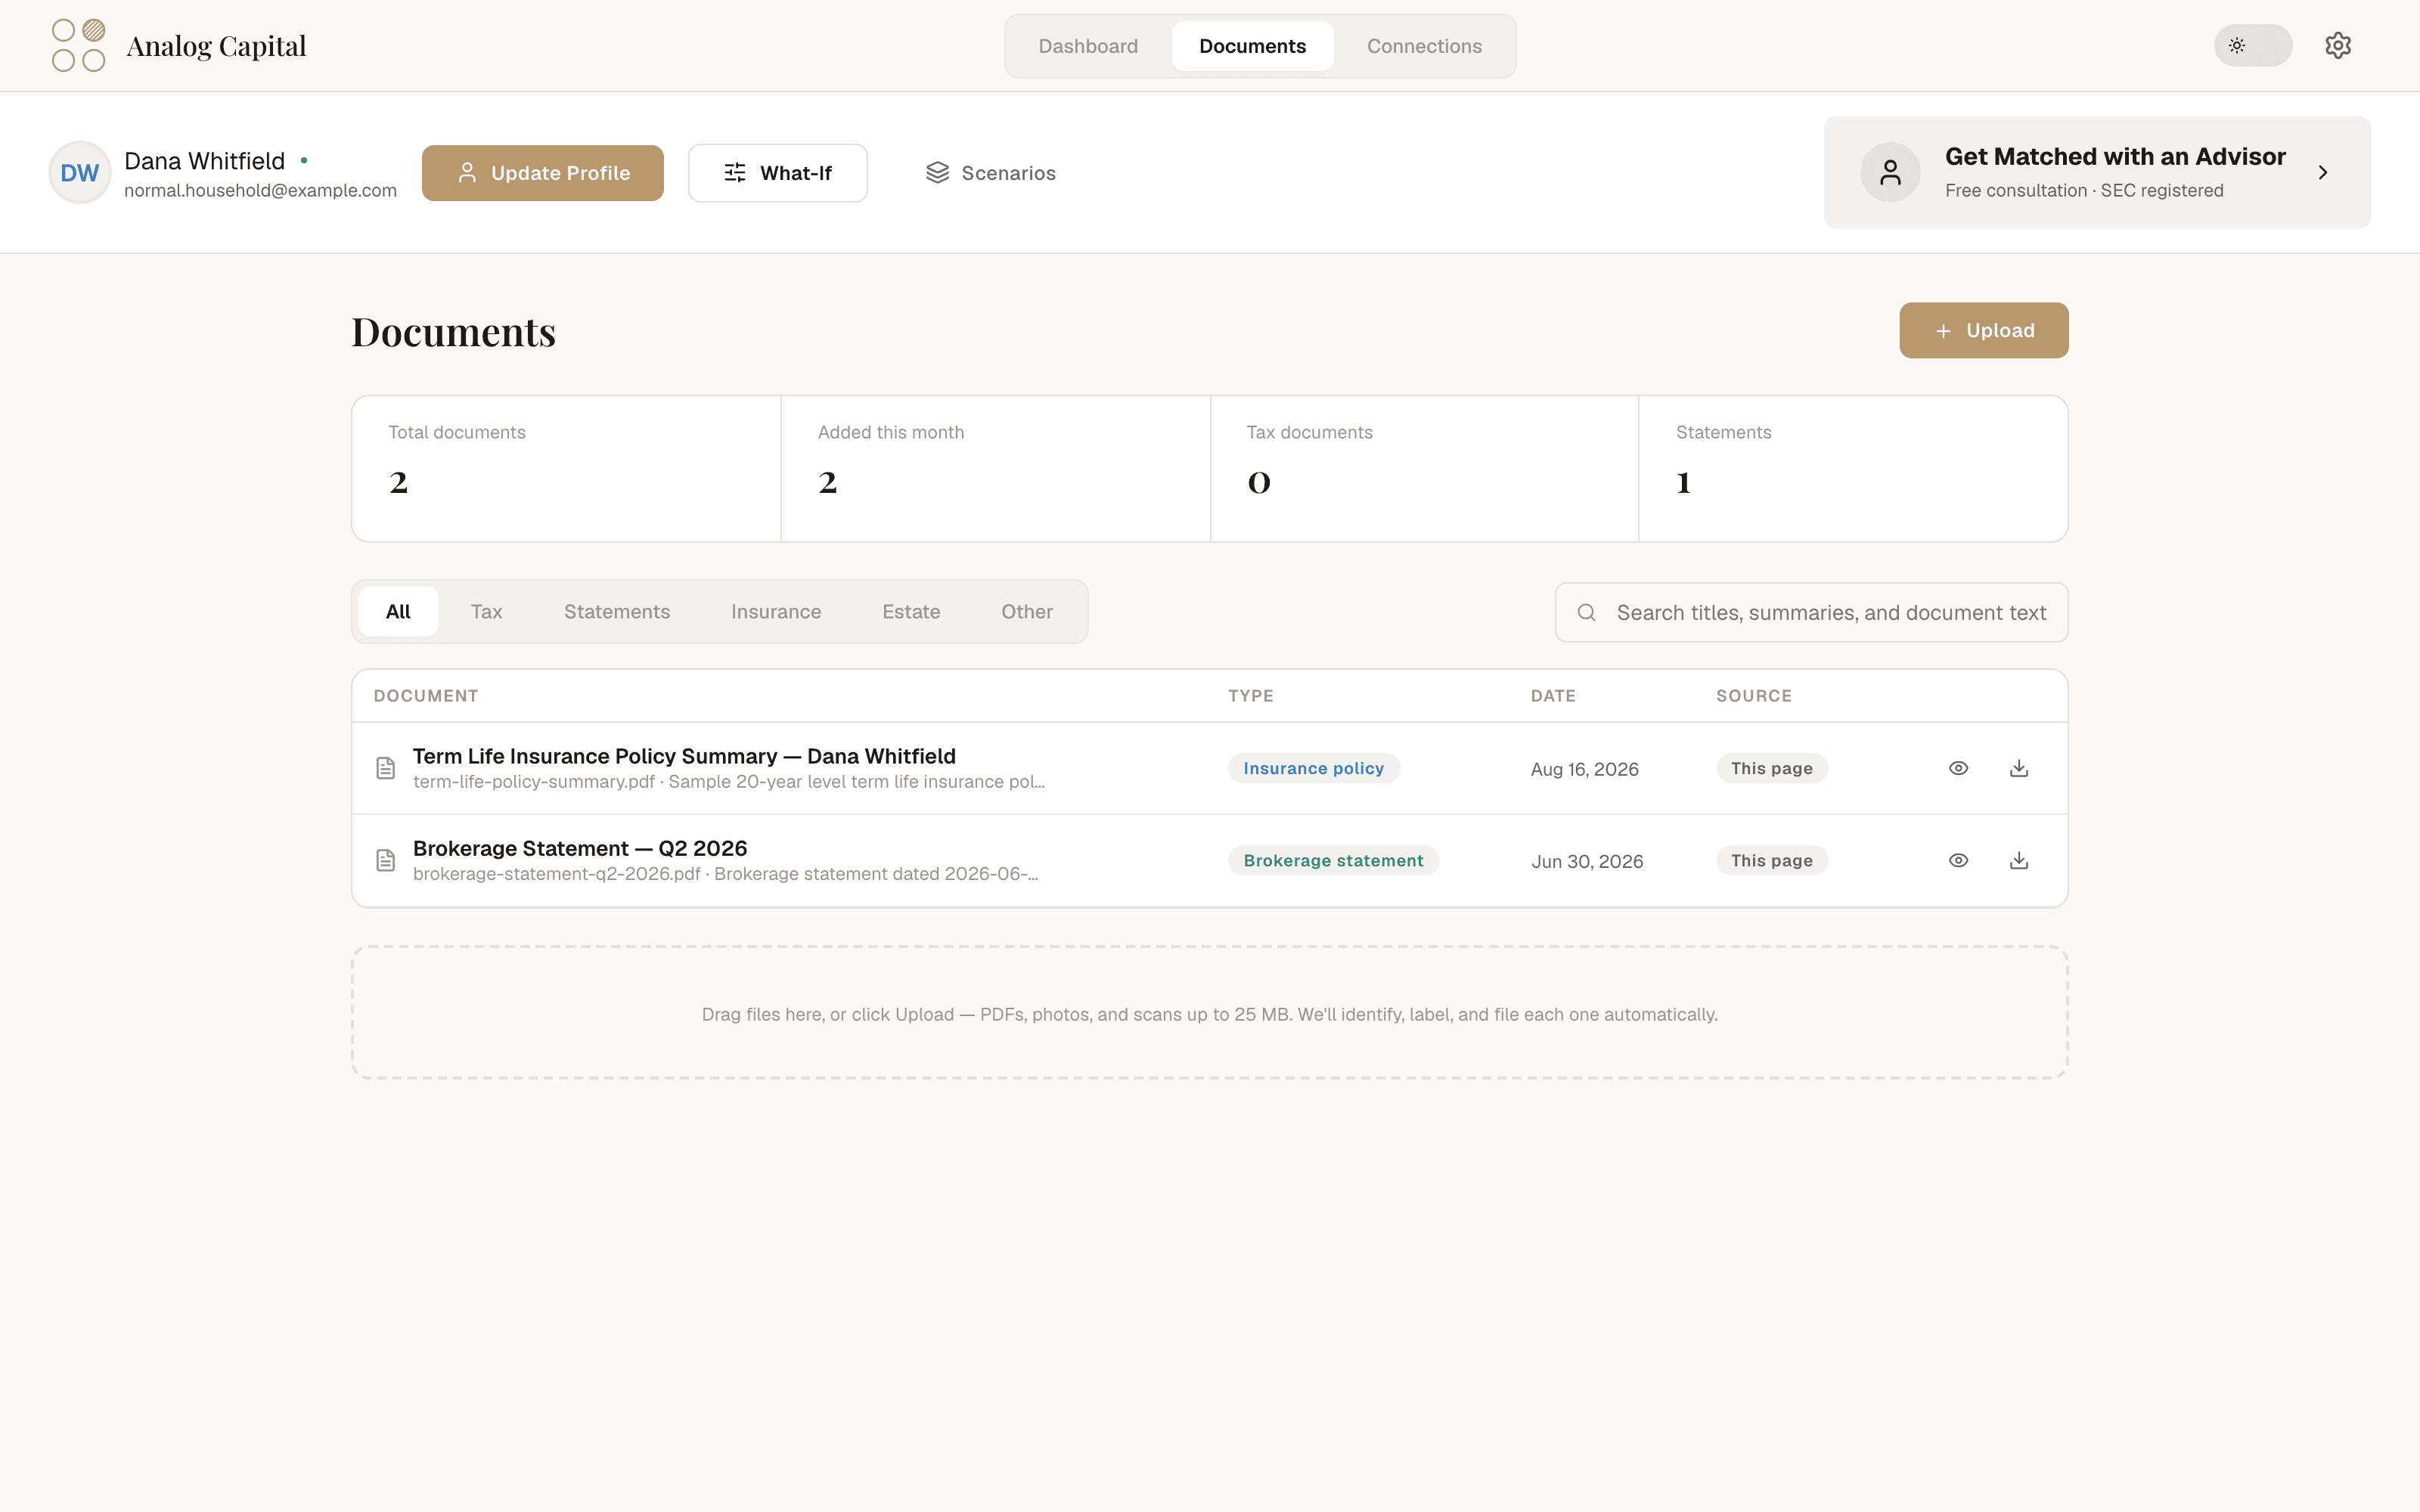
It does more than answer questions about the page you happen to be looking at. It works on your actual plan: it models the change you describe, saves the scenarios worth keeping, and carries out the updates you approve — asking before it adds anything. Send it a statement and it reads the document; reply to its email and it picks the thread back up. When you would rather talk to a person, a licensed advisor sees the same plan.

Shown: a sample household, built with fictional data.

Lifespans & insurance

Coverage that changes the answer.

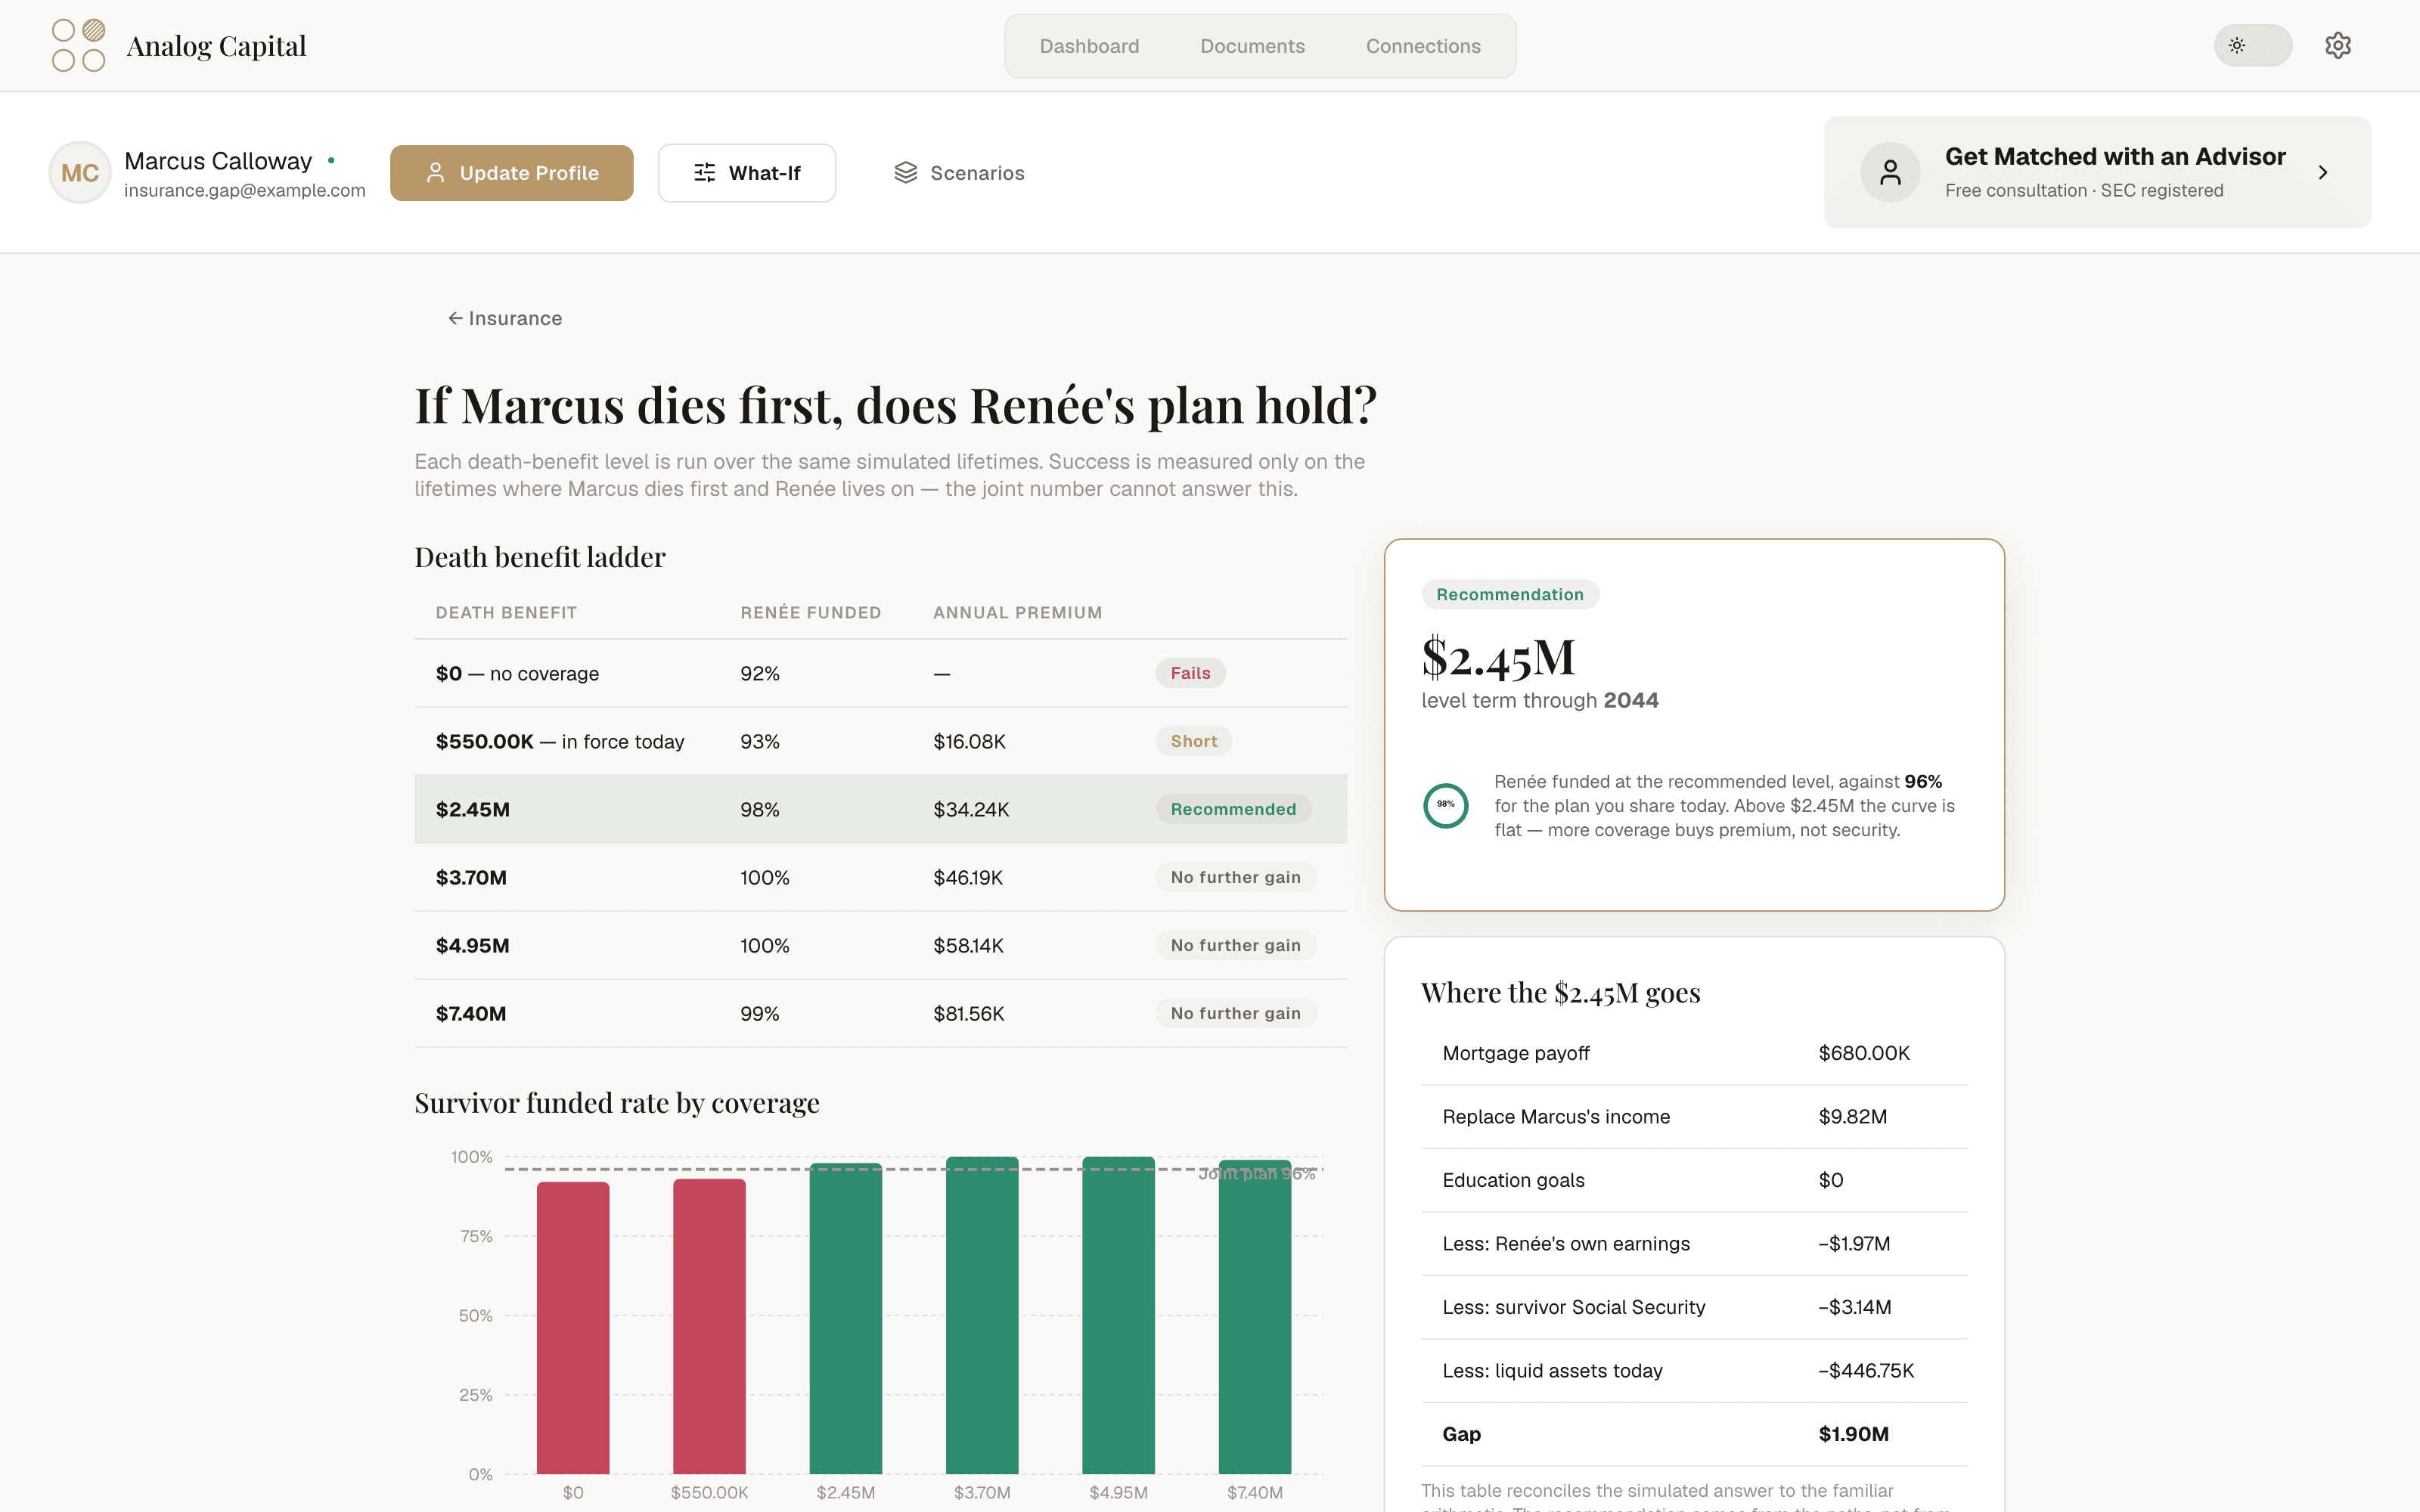
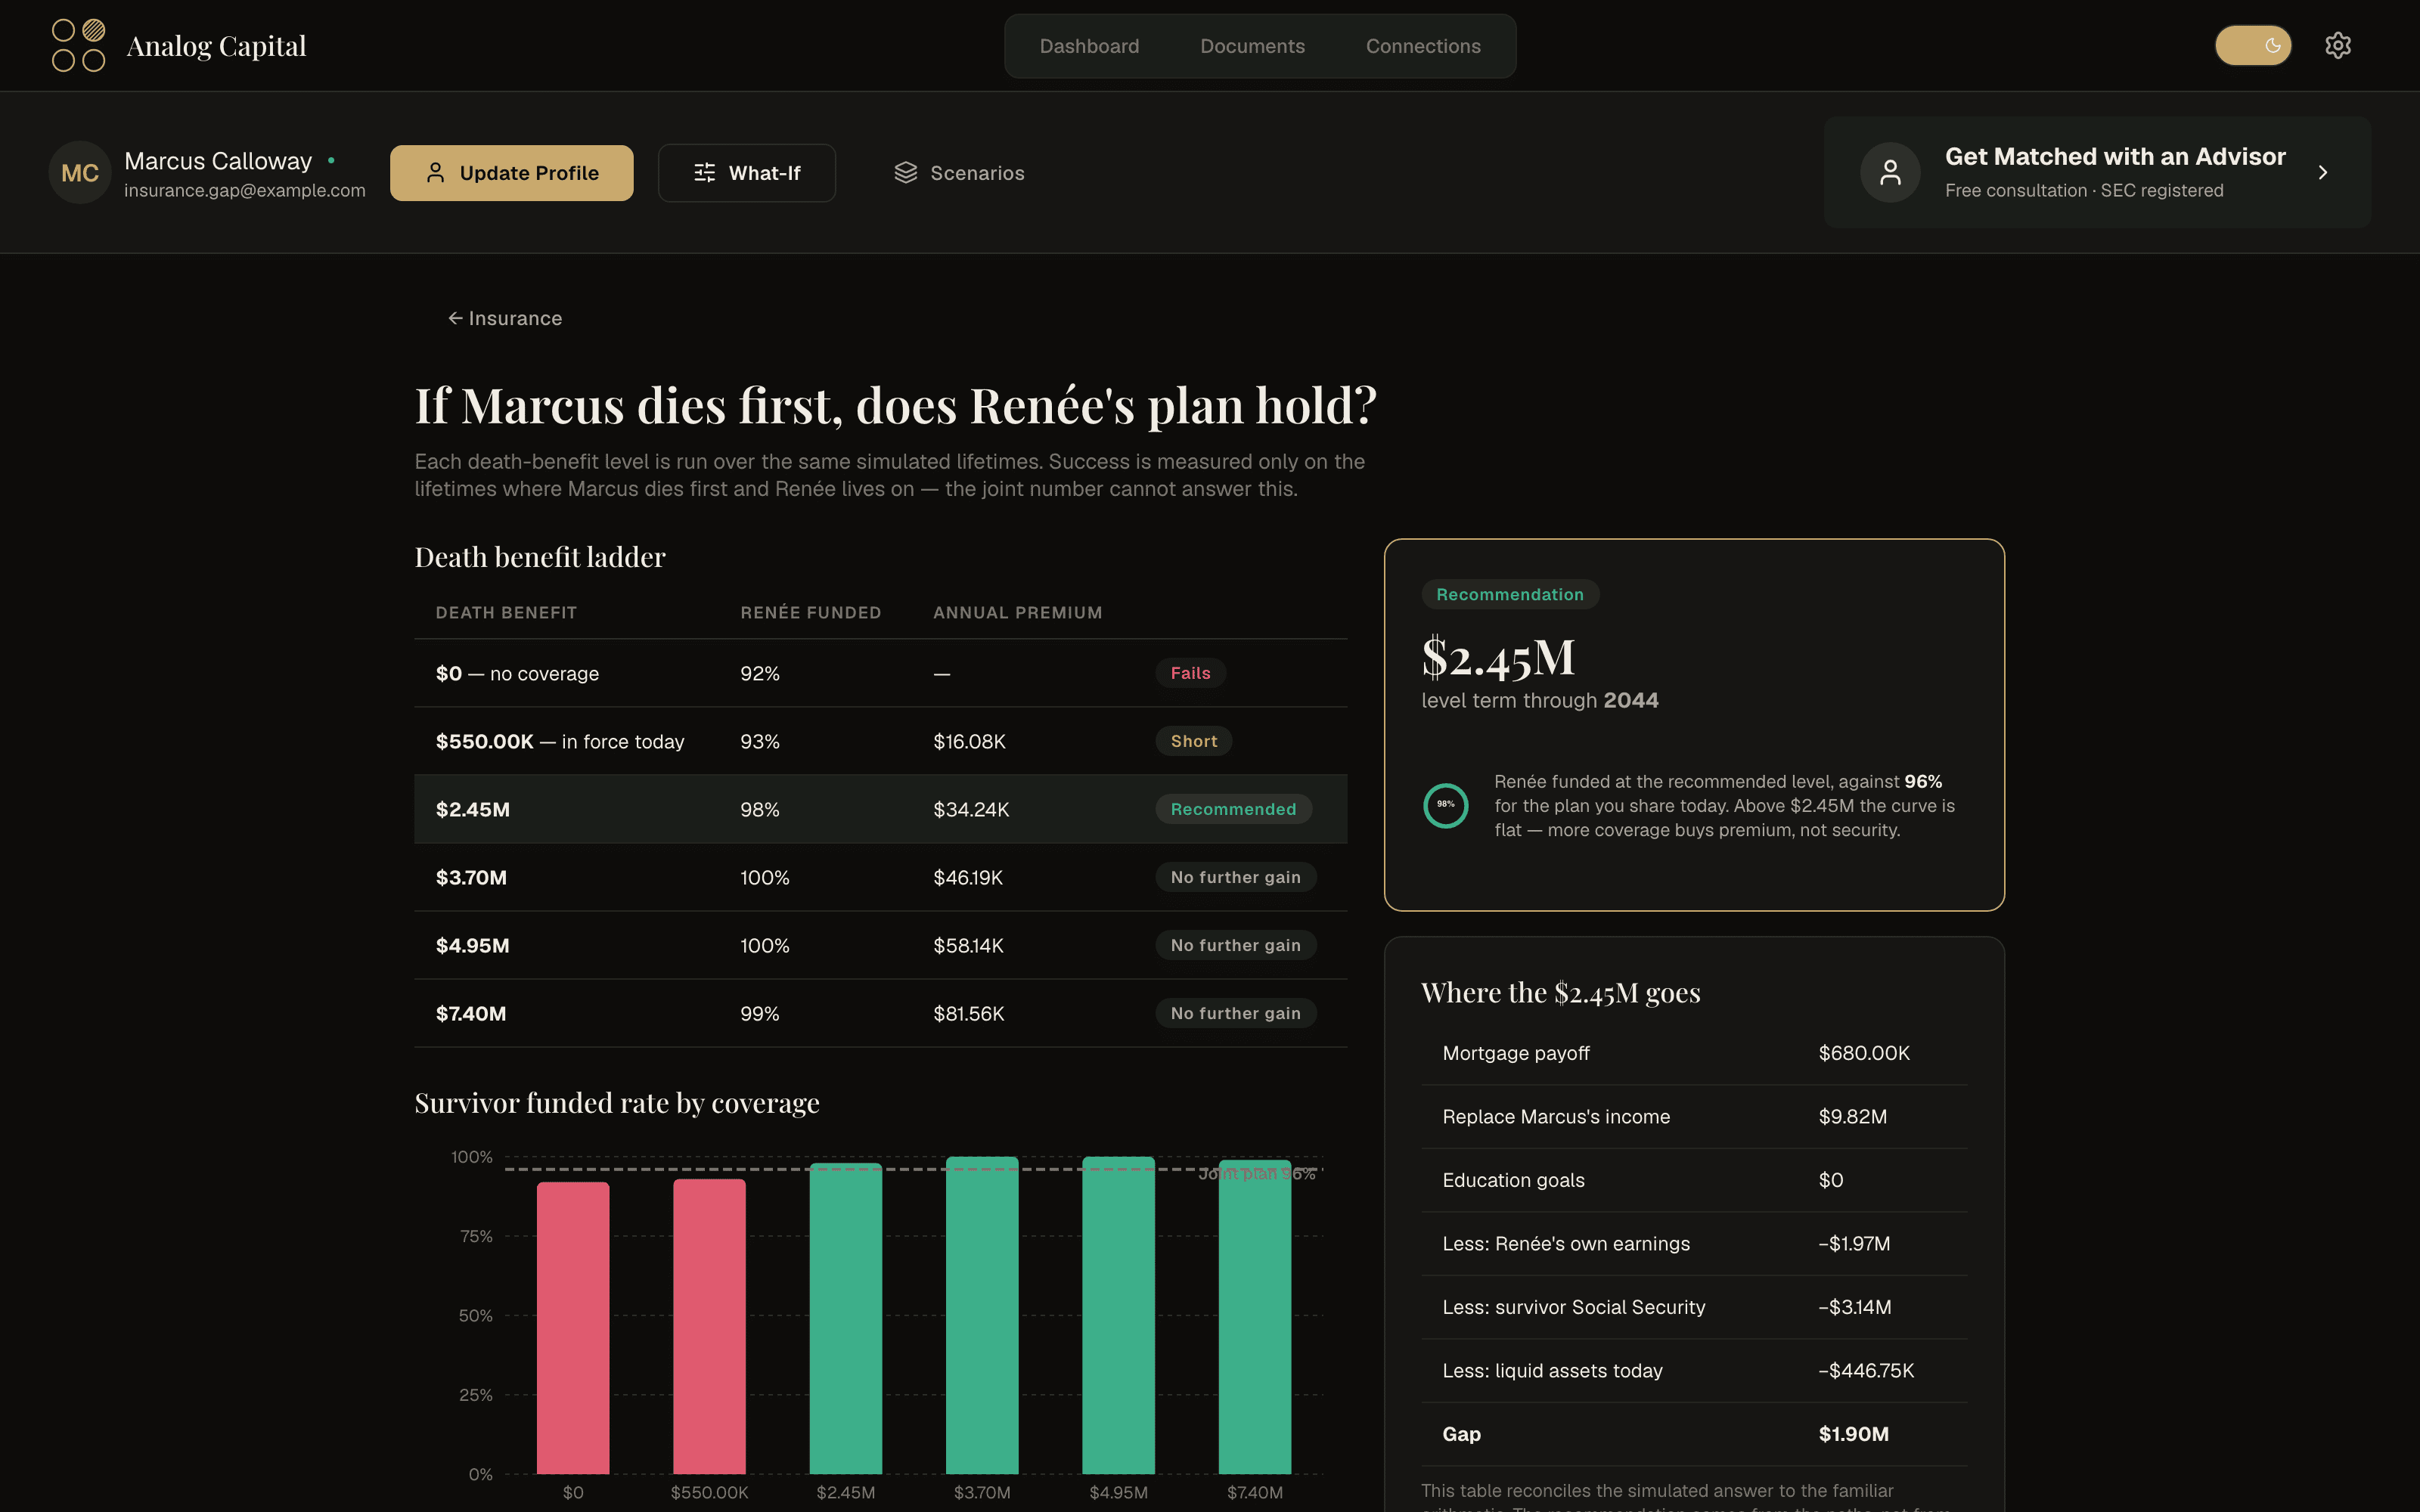
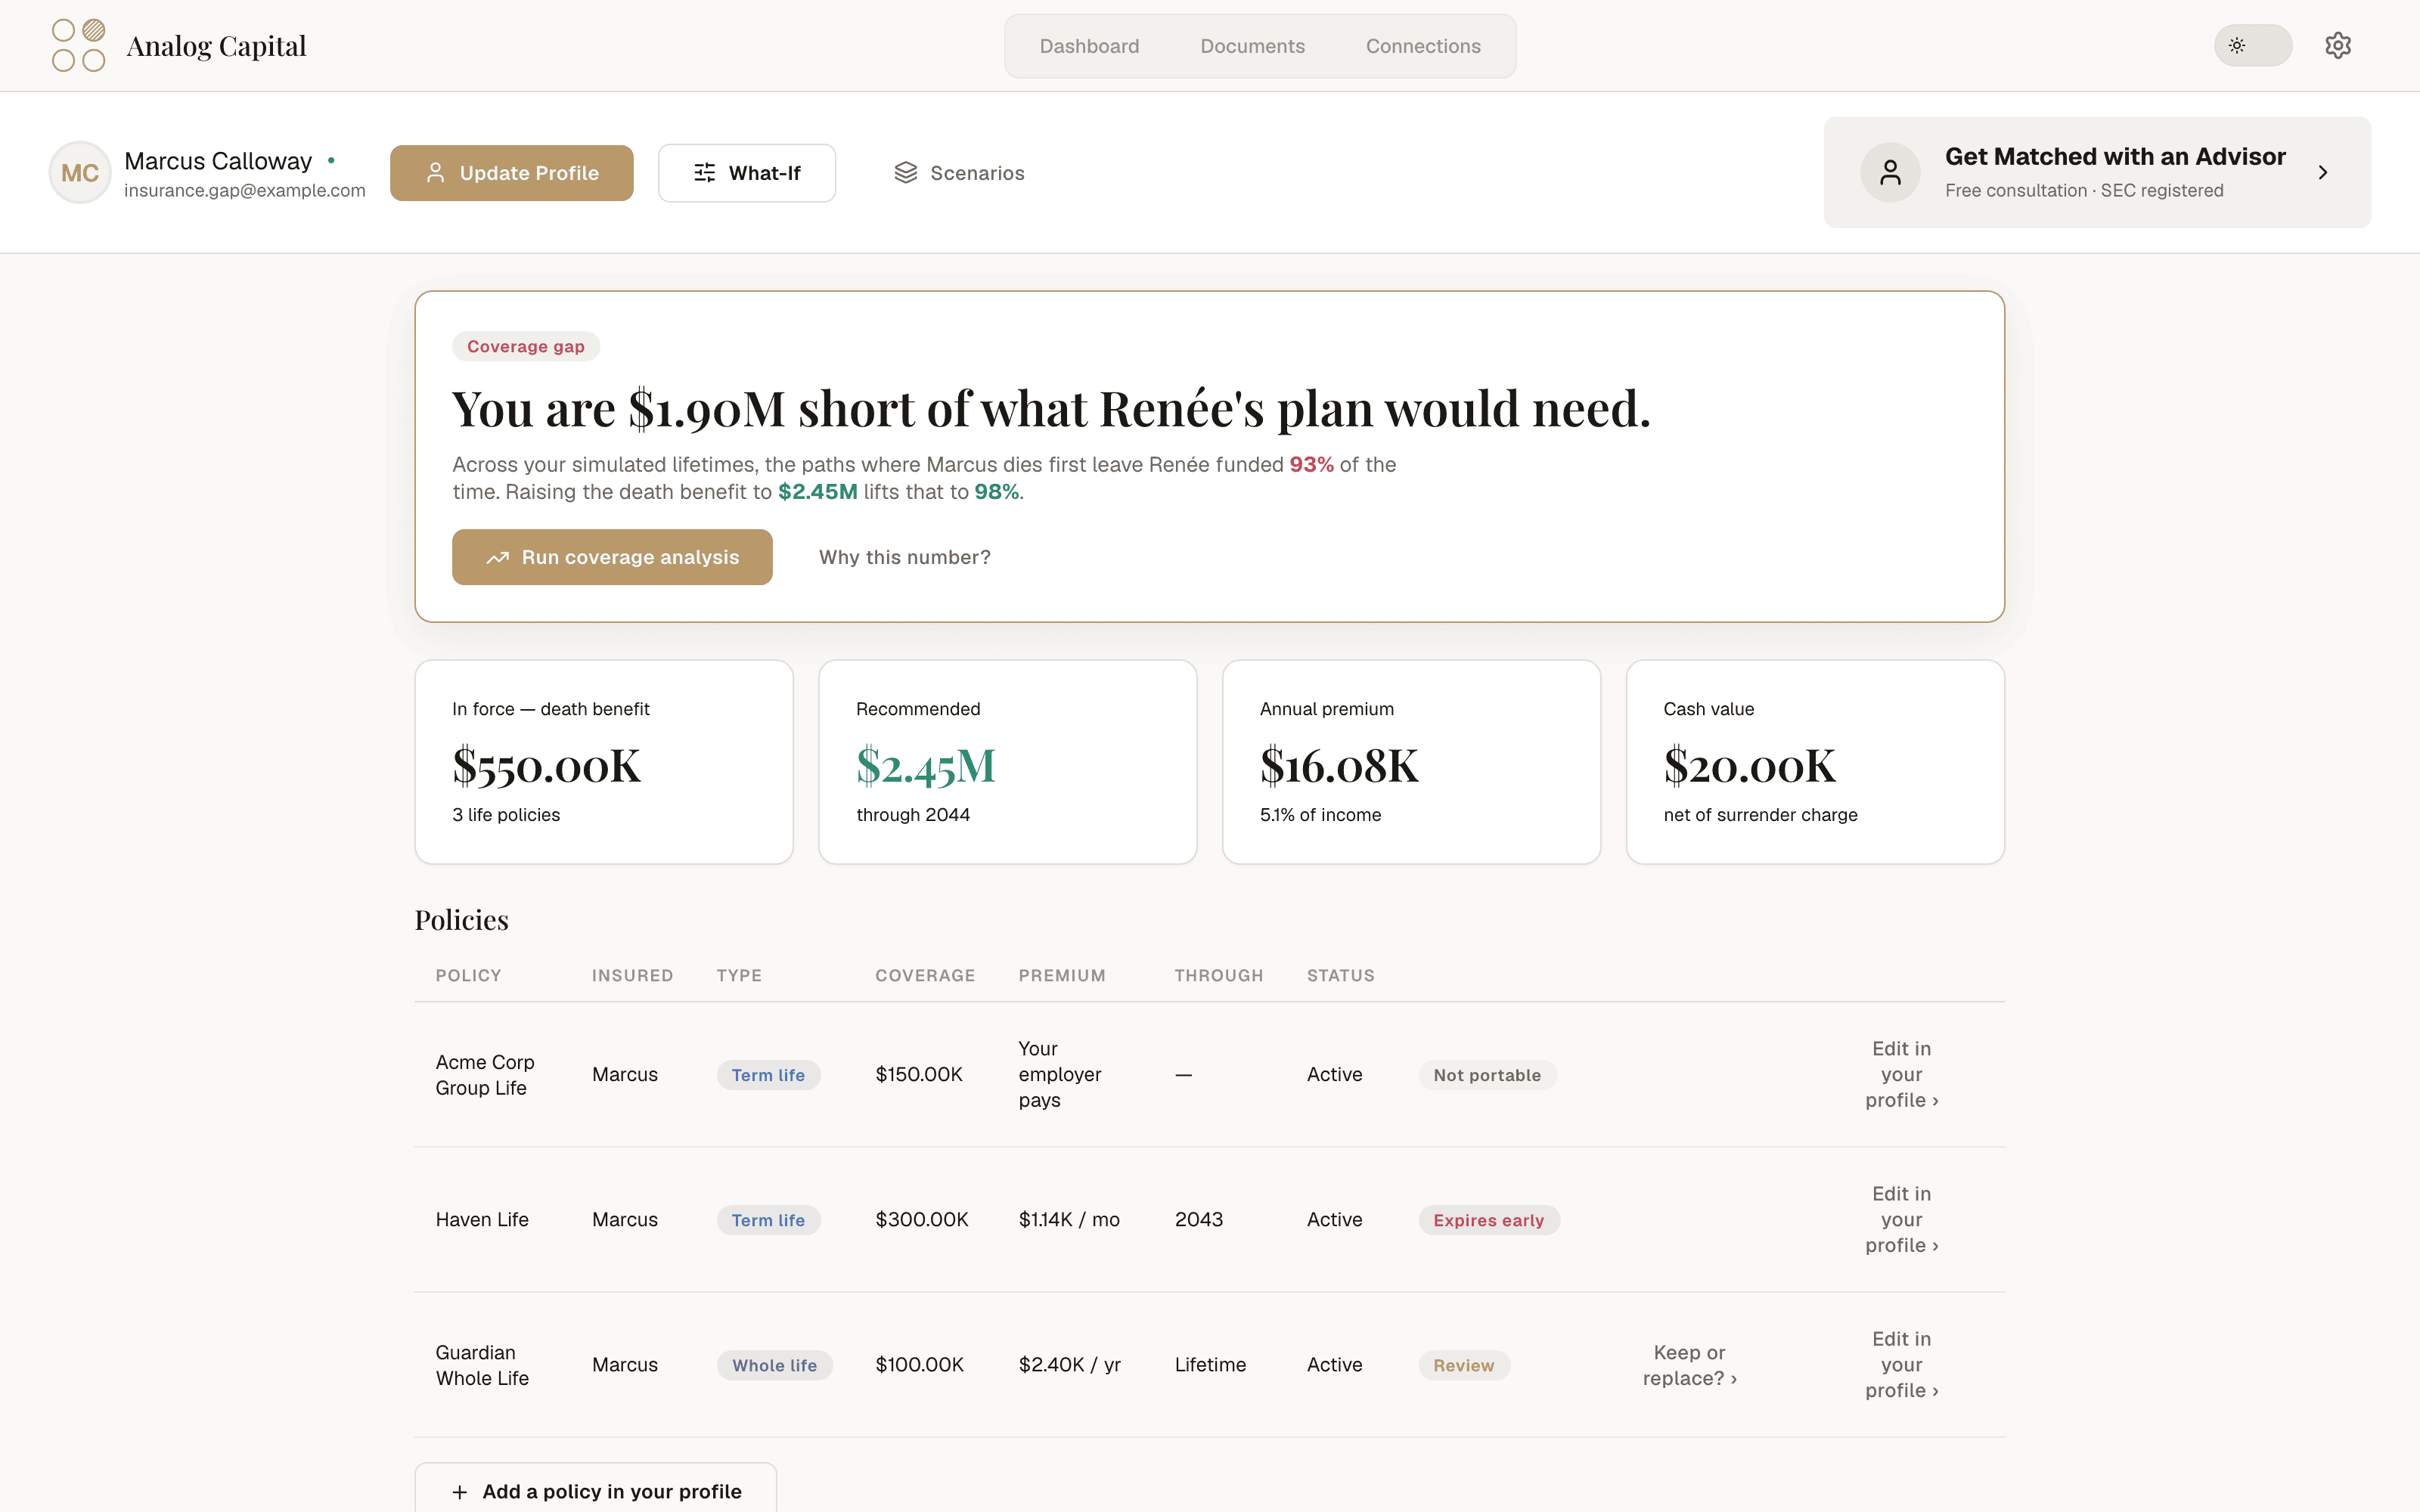
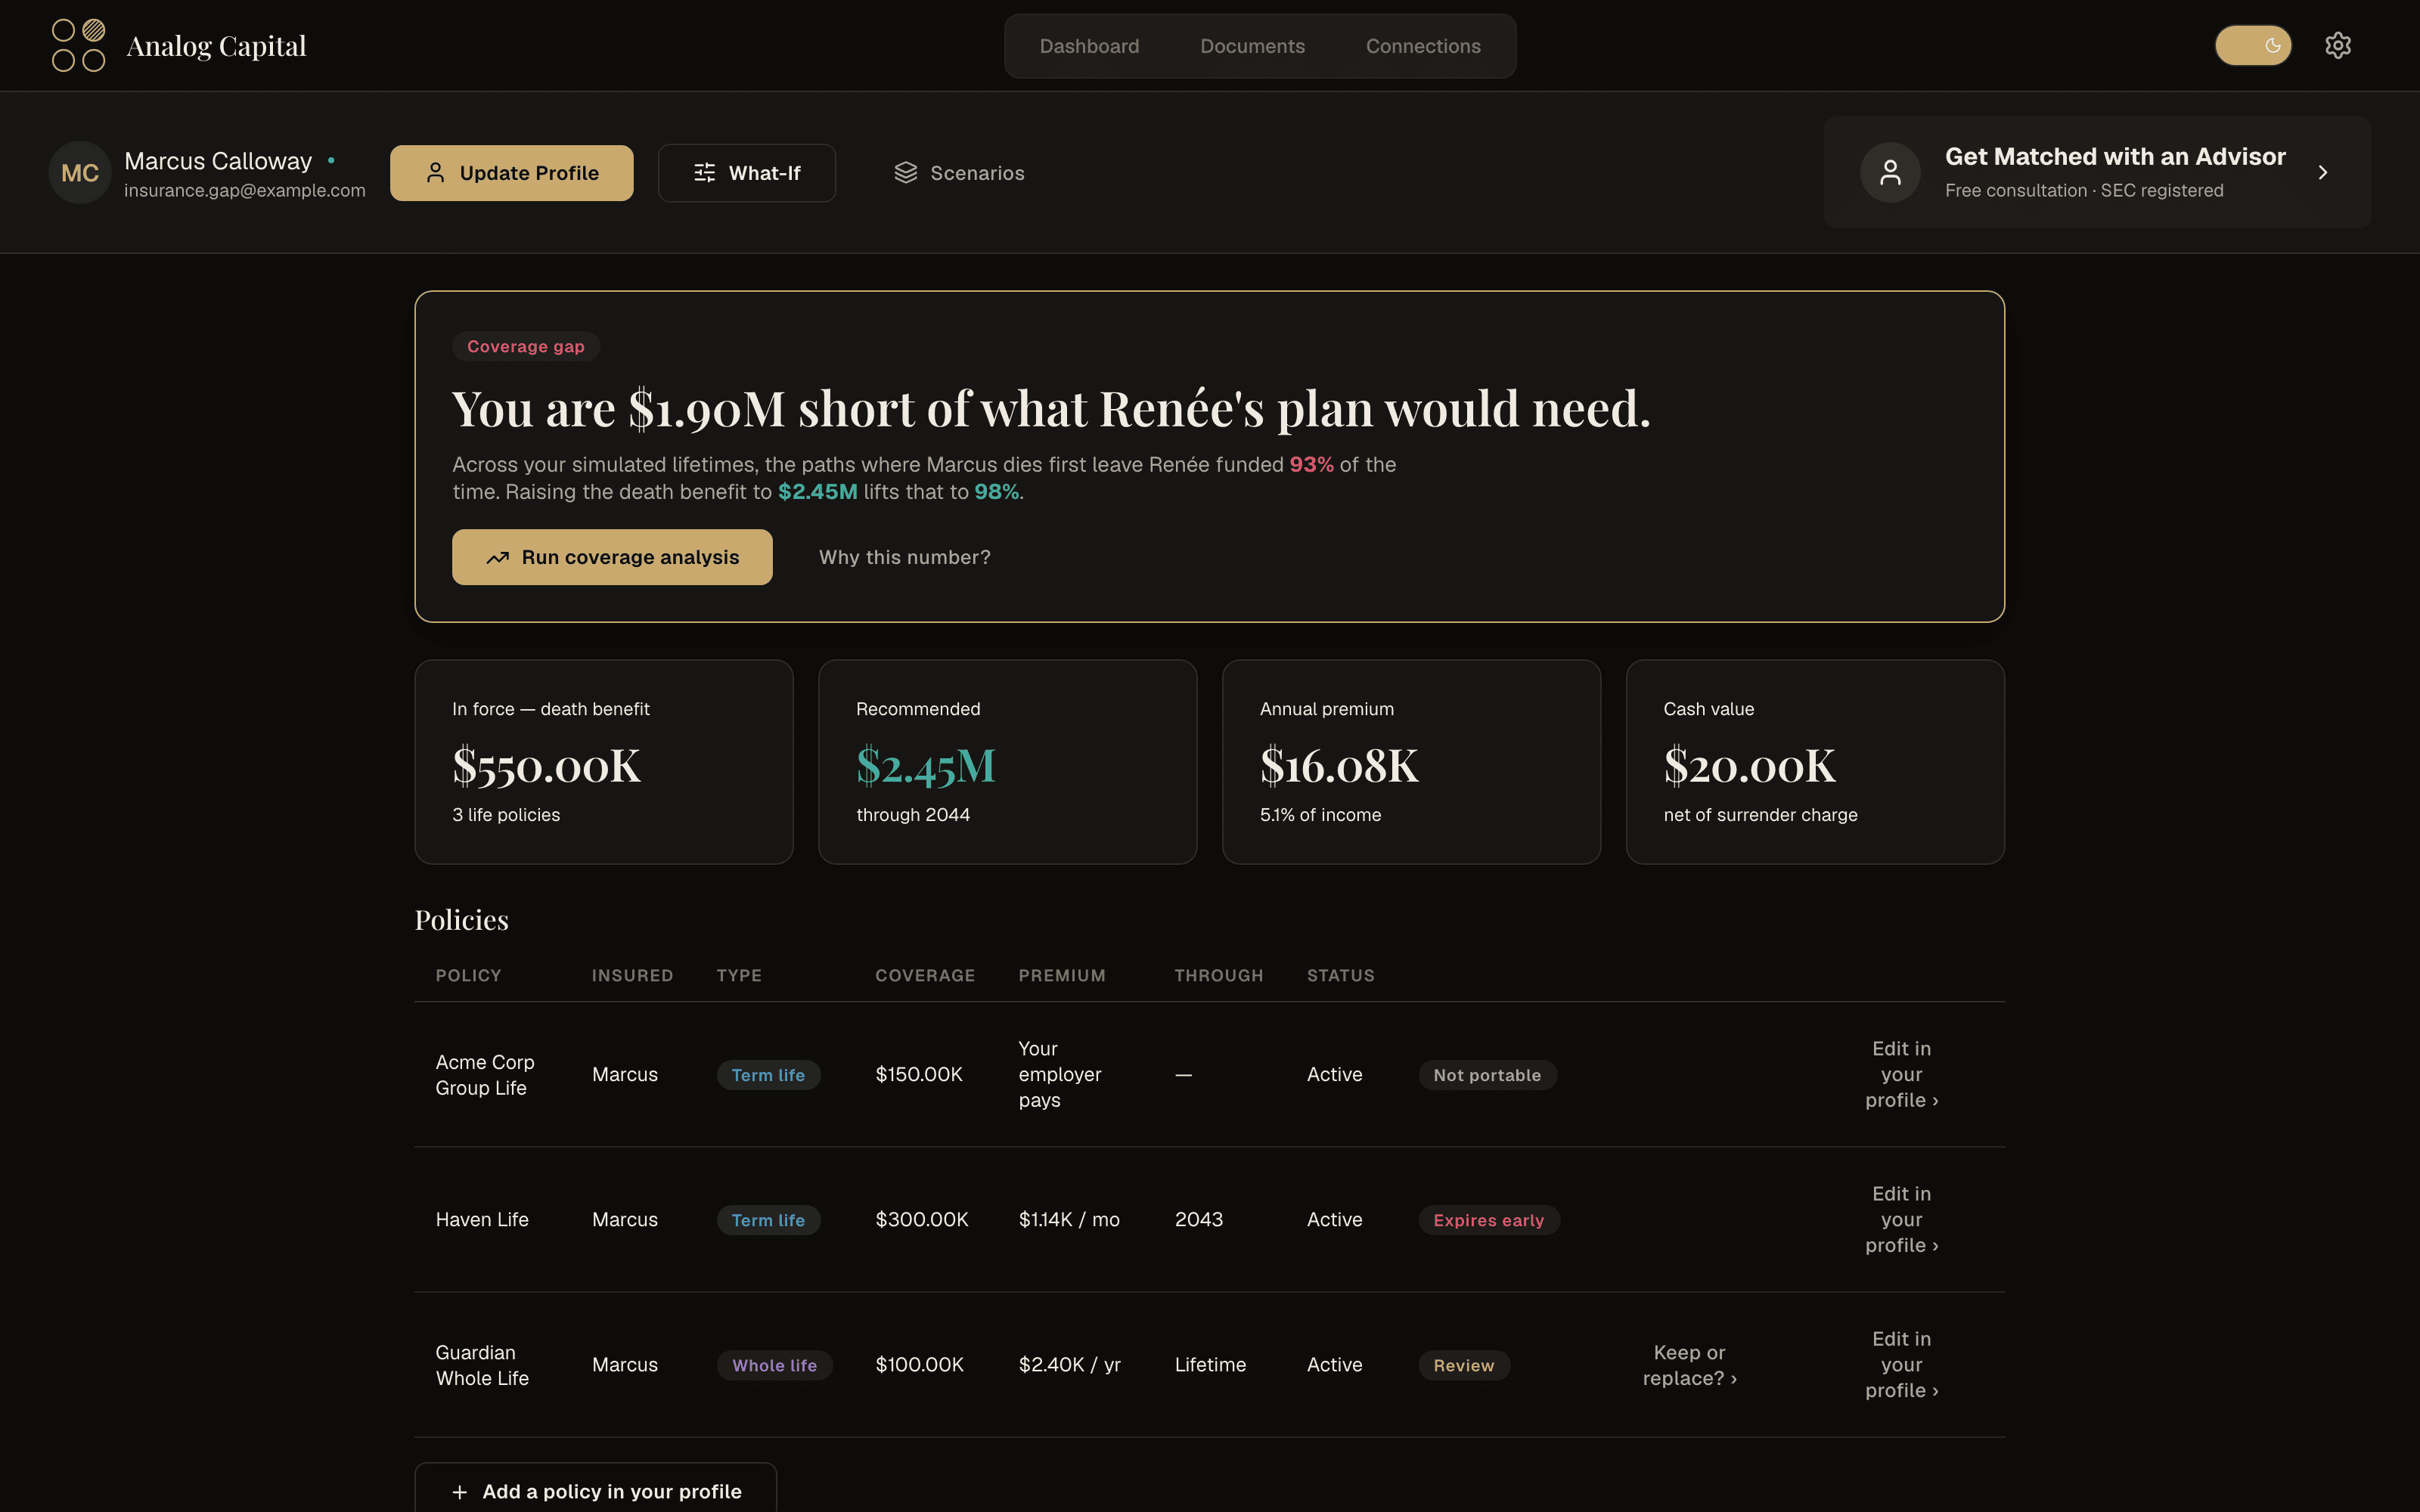
Where a projection pins every lifespan to a fixed age, insurance can only ever be a checklist item. Here, lifespans vary across the 1,000 paths the way they vary in life, and each path carries the consequence: income stops, survivor Social Security begins, the death benefit arrives. Your coverage moves your results because it is inside the analysis, not beside it. That works in both directions — the analysis will name the coverage that closes a gap, and it will tell you just as readily when you have grown wealthy enough to stop paying for coverage you no longer need.

Shown: a sample household, built with fictional data.

Estate

Your plan does not end at retirement. Neither does ours.

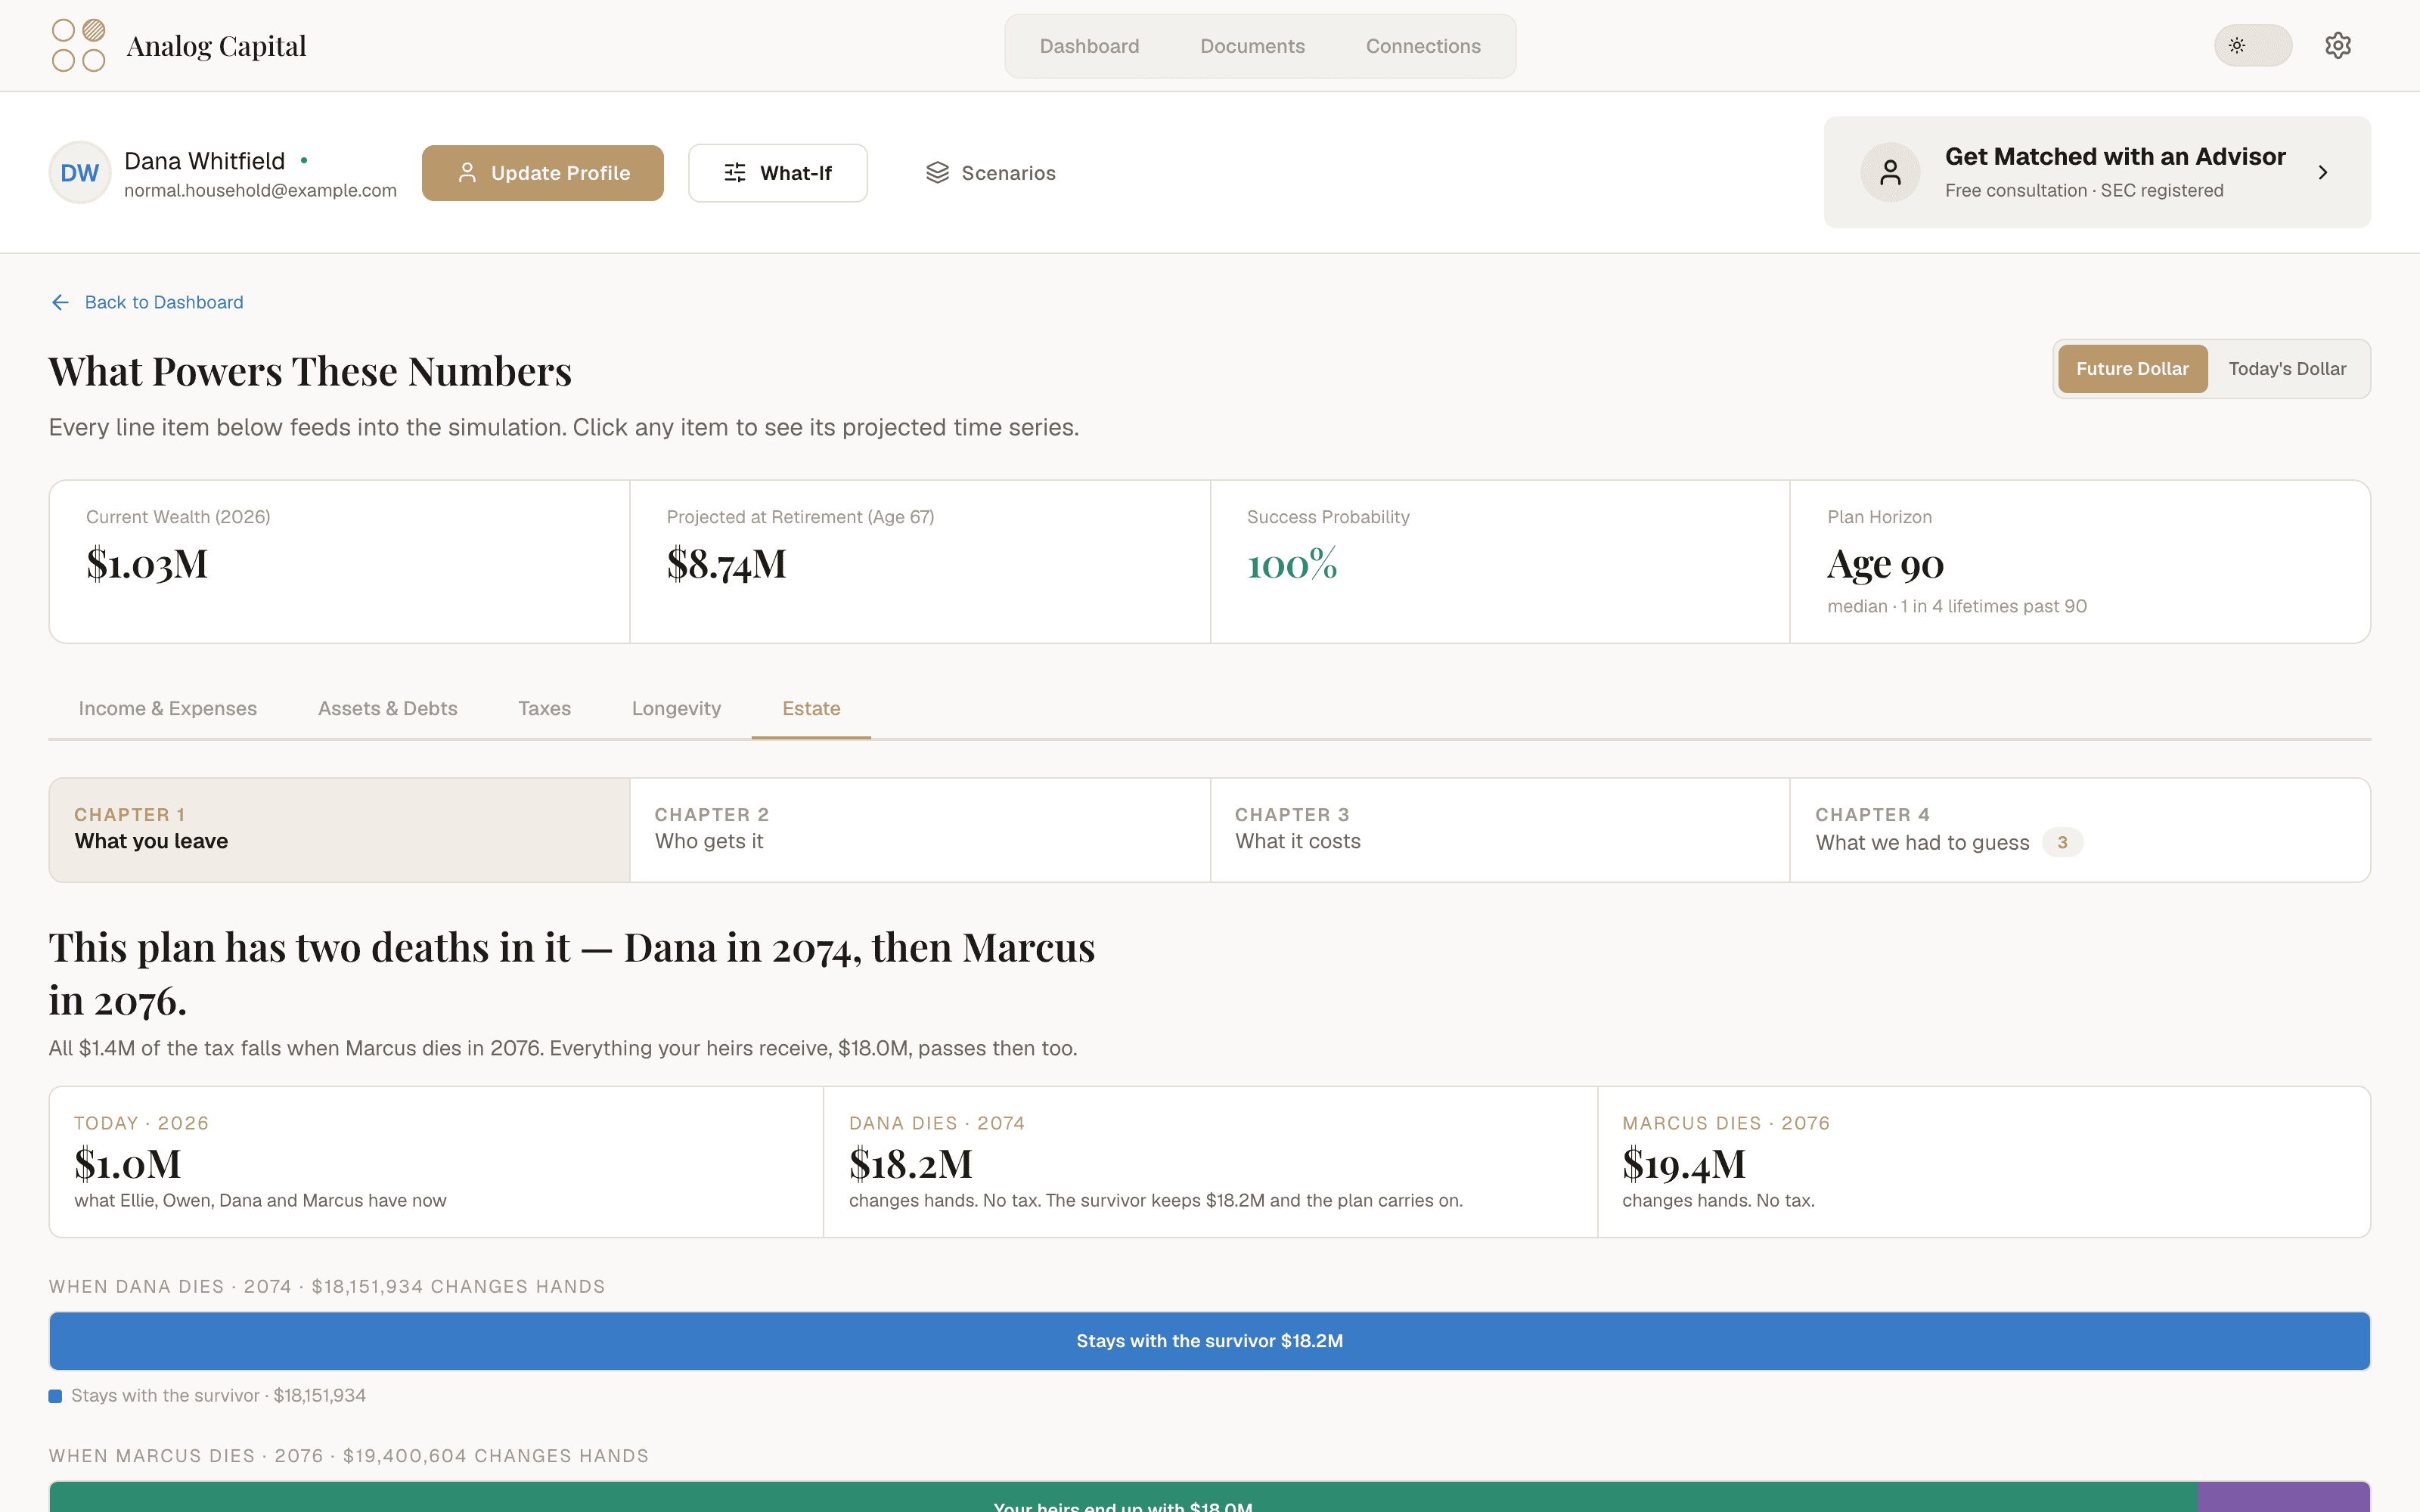
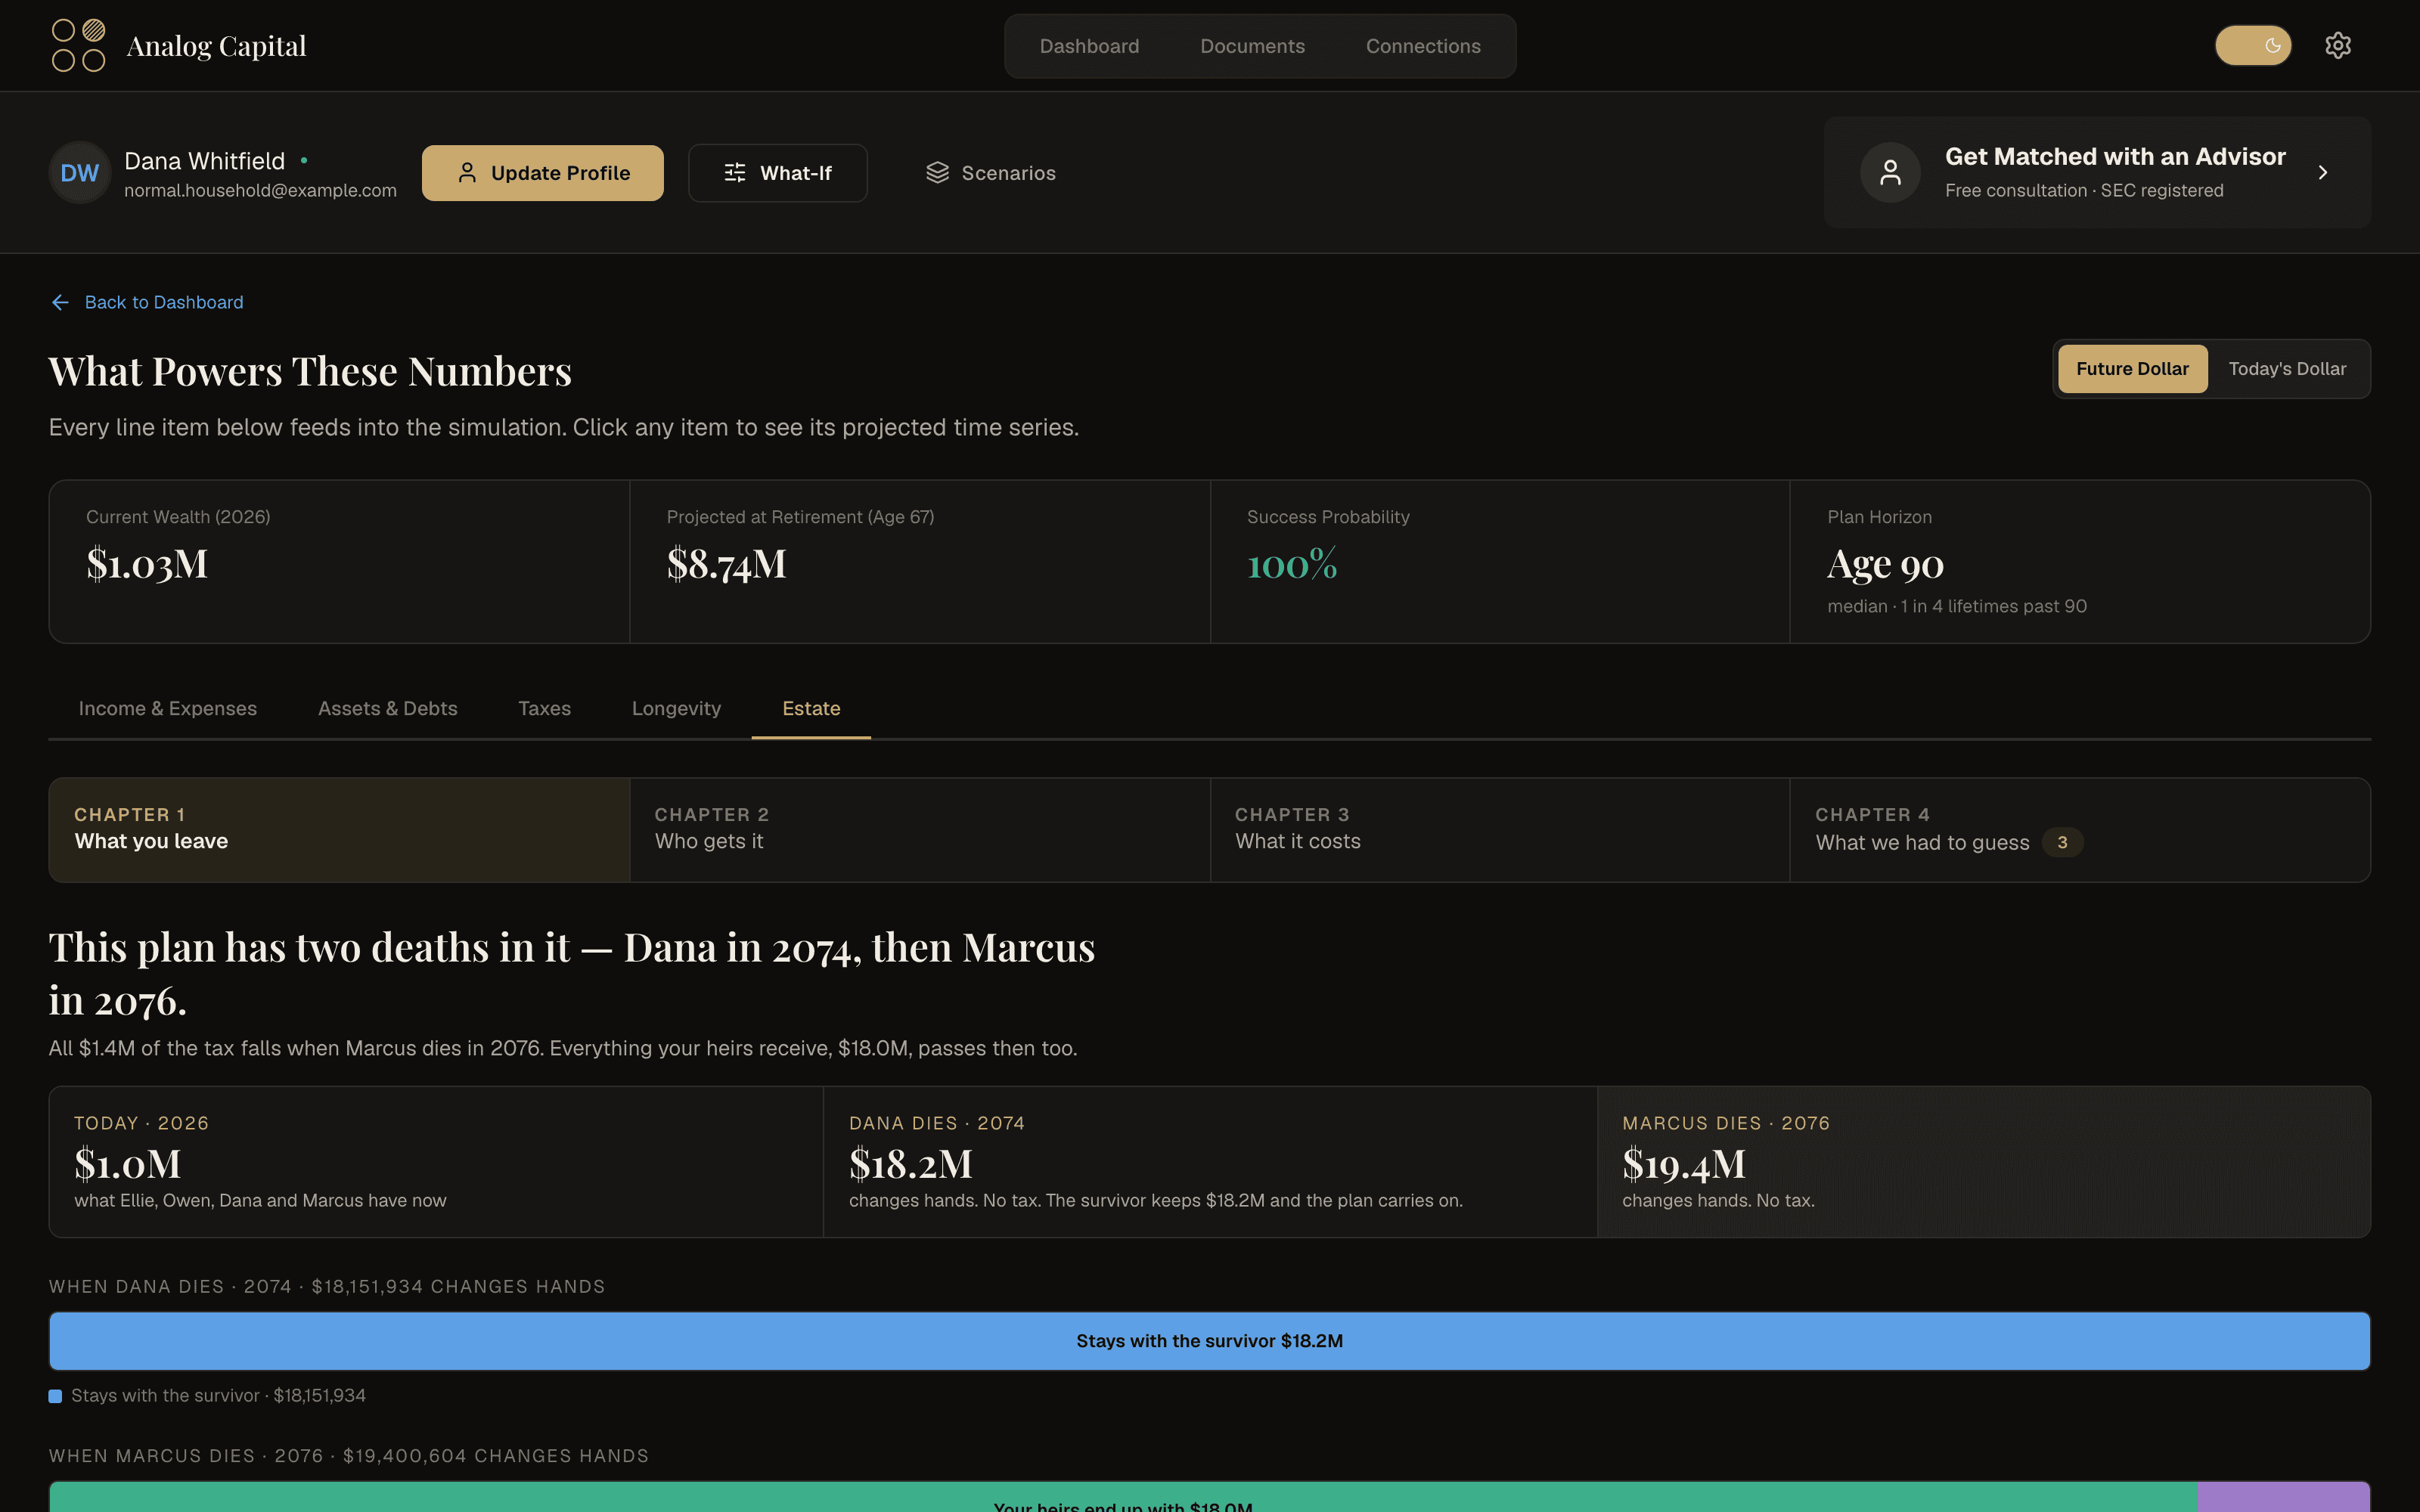
It is easy to stop at “did the money last.” We follow the plan all the way through: what you leave, who receives it — honoring your will, your trusts, and the beneficiaries named on each account — what it costs in tax, and which questions we had to assume an answer to because no document you have gave one. Estate planning is not a separate product here. It is the last chapter of the same analysis.

The estate chapter of a plan: what passes at each death, to whom, and at what cost
What passes at each death, to whom, and what it costs — inside the same plan.

Shown: a sample household, built with fictional data.

Real life, modeled

Your life is not a straight line. Your plan should not be either.

The events that actually decide a plan are the ones an average cannot hold: buying the next house and selling this one, a mortgage amortizing down to its payoff date, stock grants vesting on their own calendar, moving retirement savings to a Roth account over several years, a college fund with real rules about what it can pay for. Each of these is modeled as the event it is — and each one re-runs the full analysis when you change it.

Houses bought and sold mid-plan, with the tax break when you sell your home applied
Mortgages and student loans amortized from their actual terms — not a guessed monthly payment
Stock grants that vest year by year on their own schedule
Retirement savings moved to a Roth account on a multi-year schedule, with the taxes of each step
College savings with real rules about what counts as a qualified expense
Your investment mix shifting with age, the way you actually invest
Connected accounts that keep balances and holdings current on their own
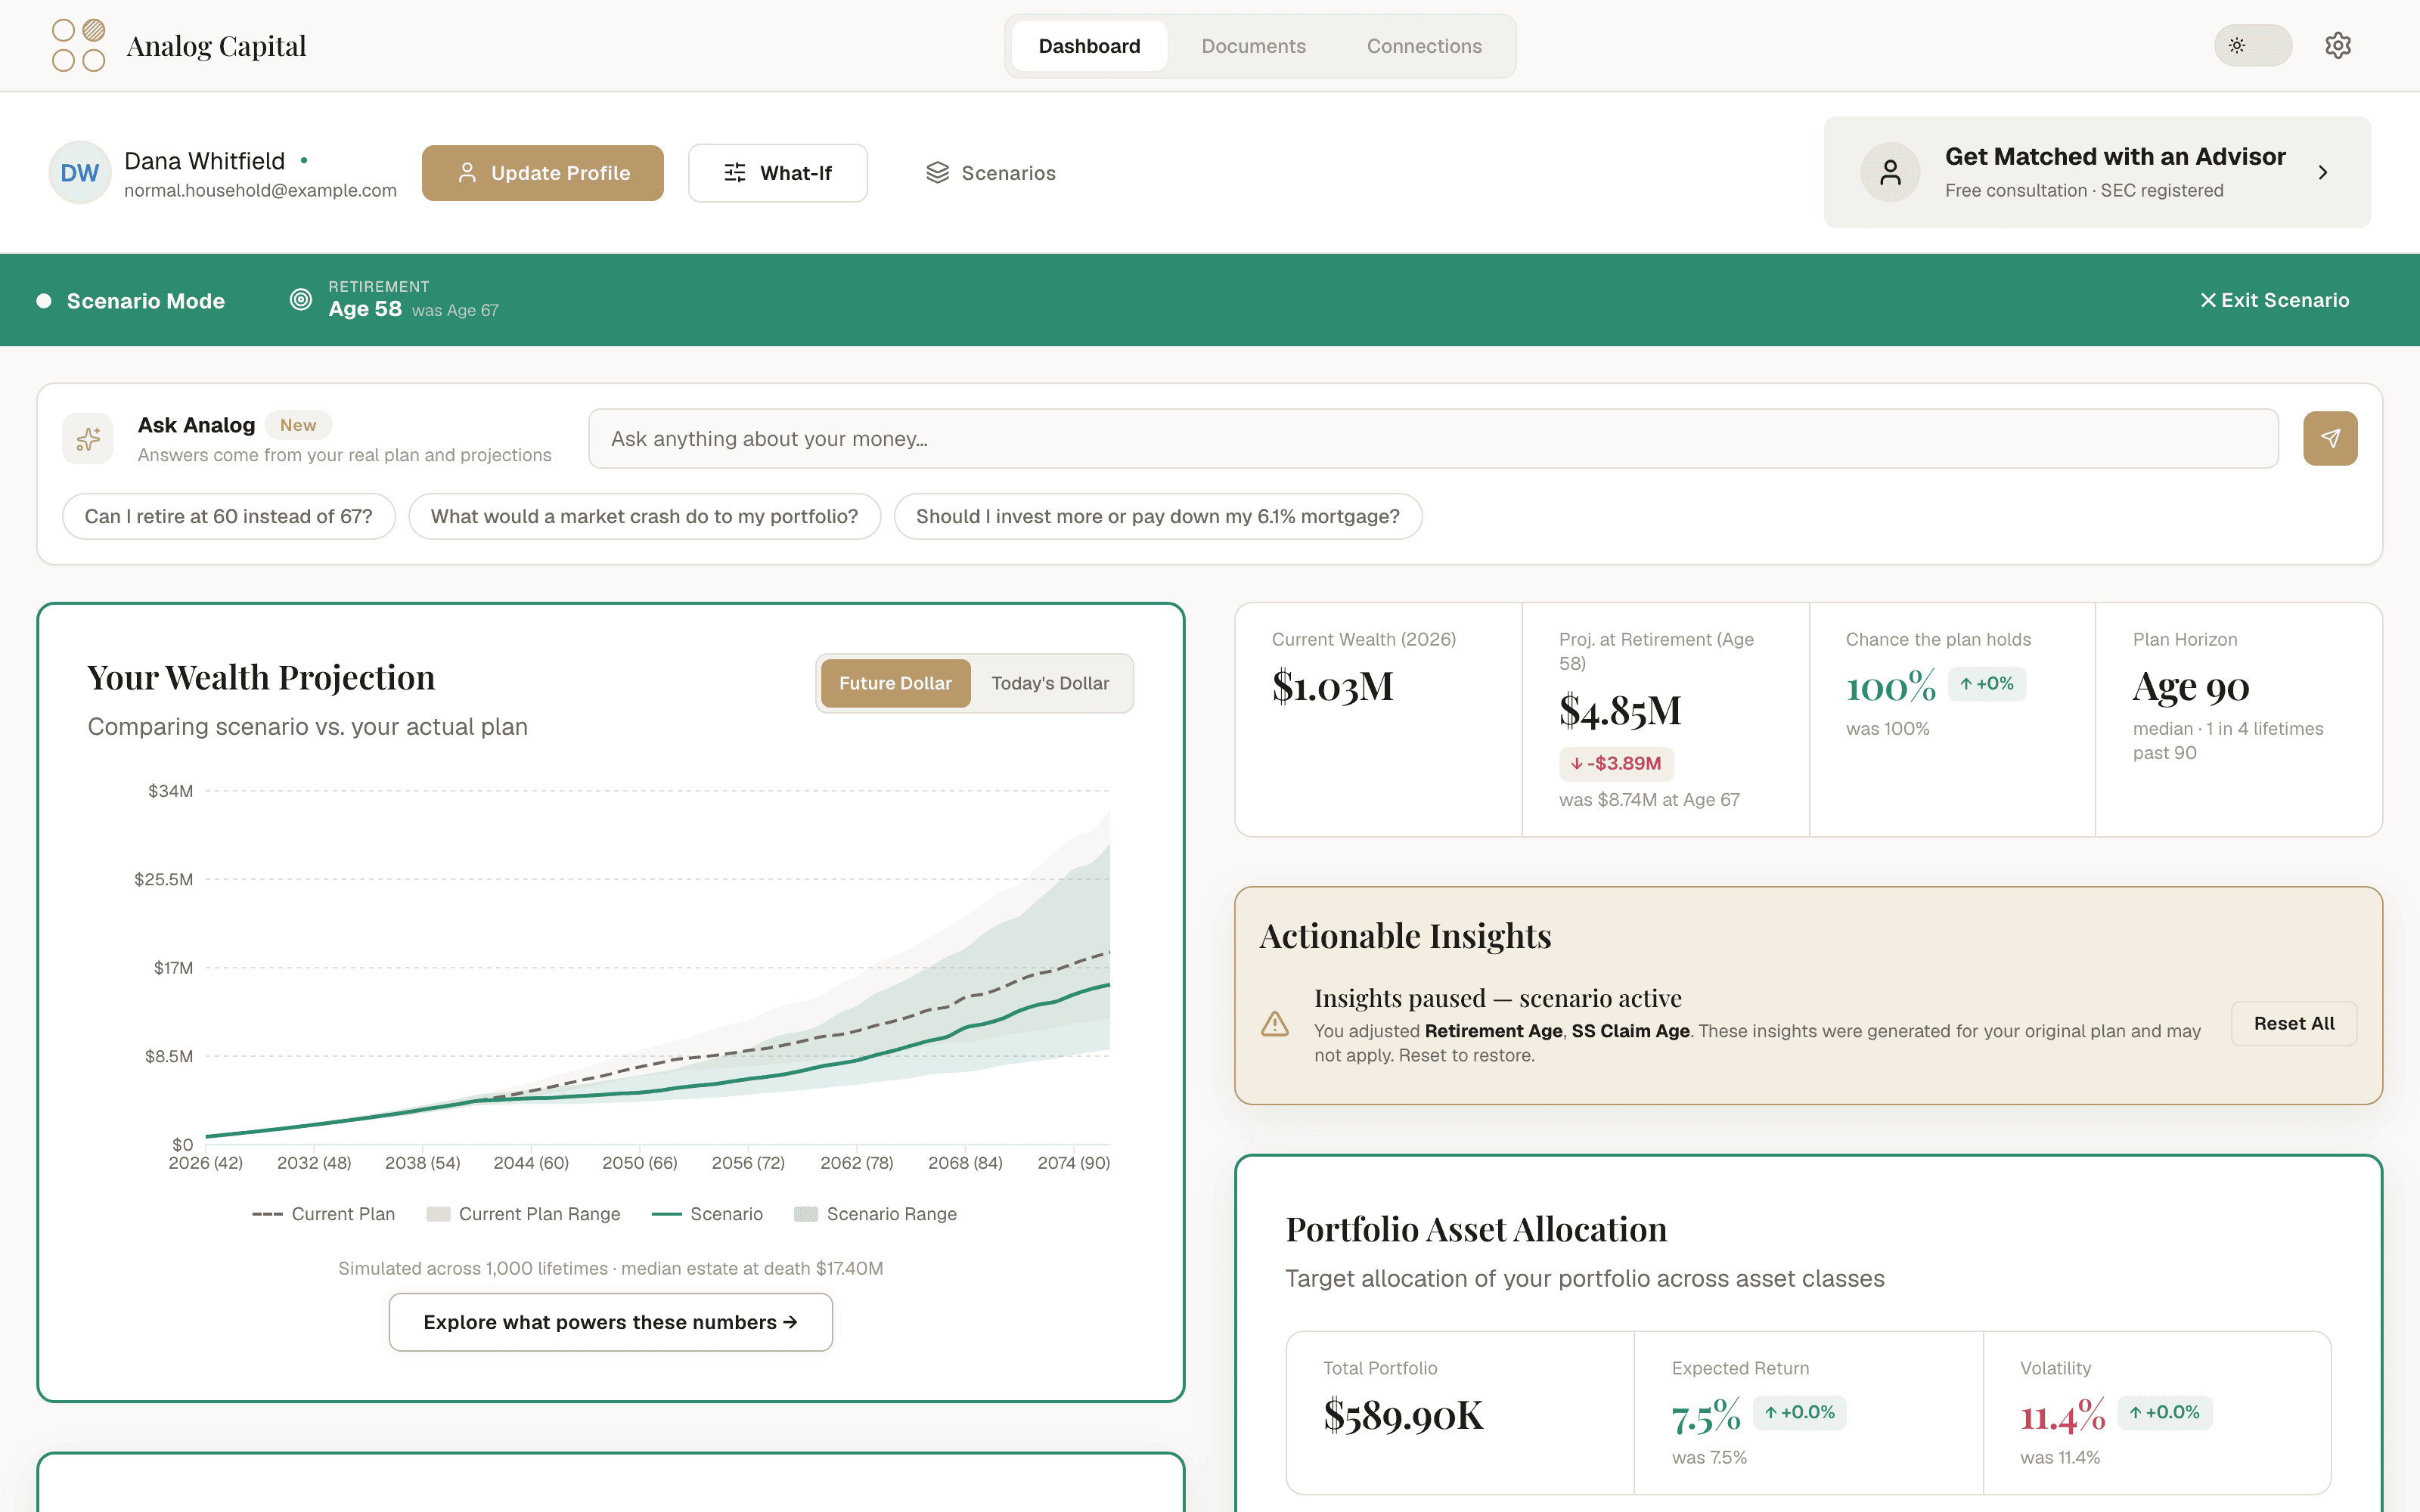
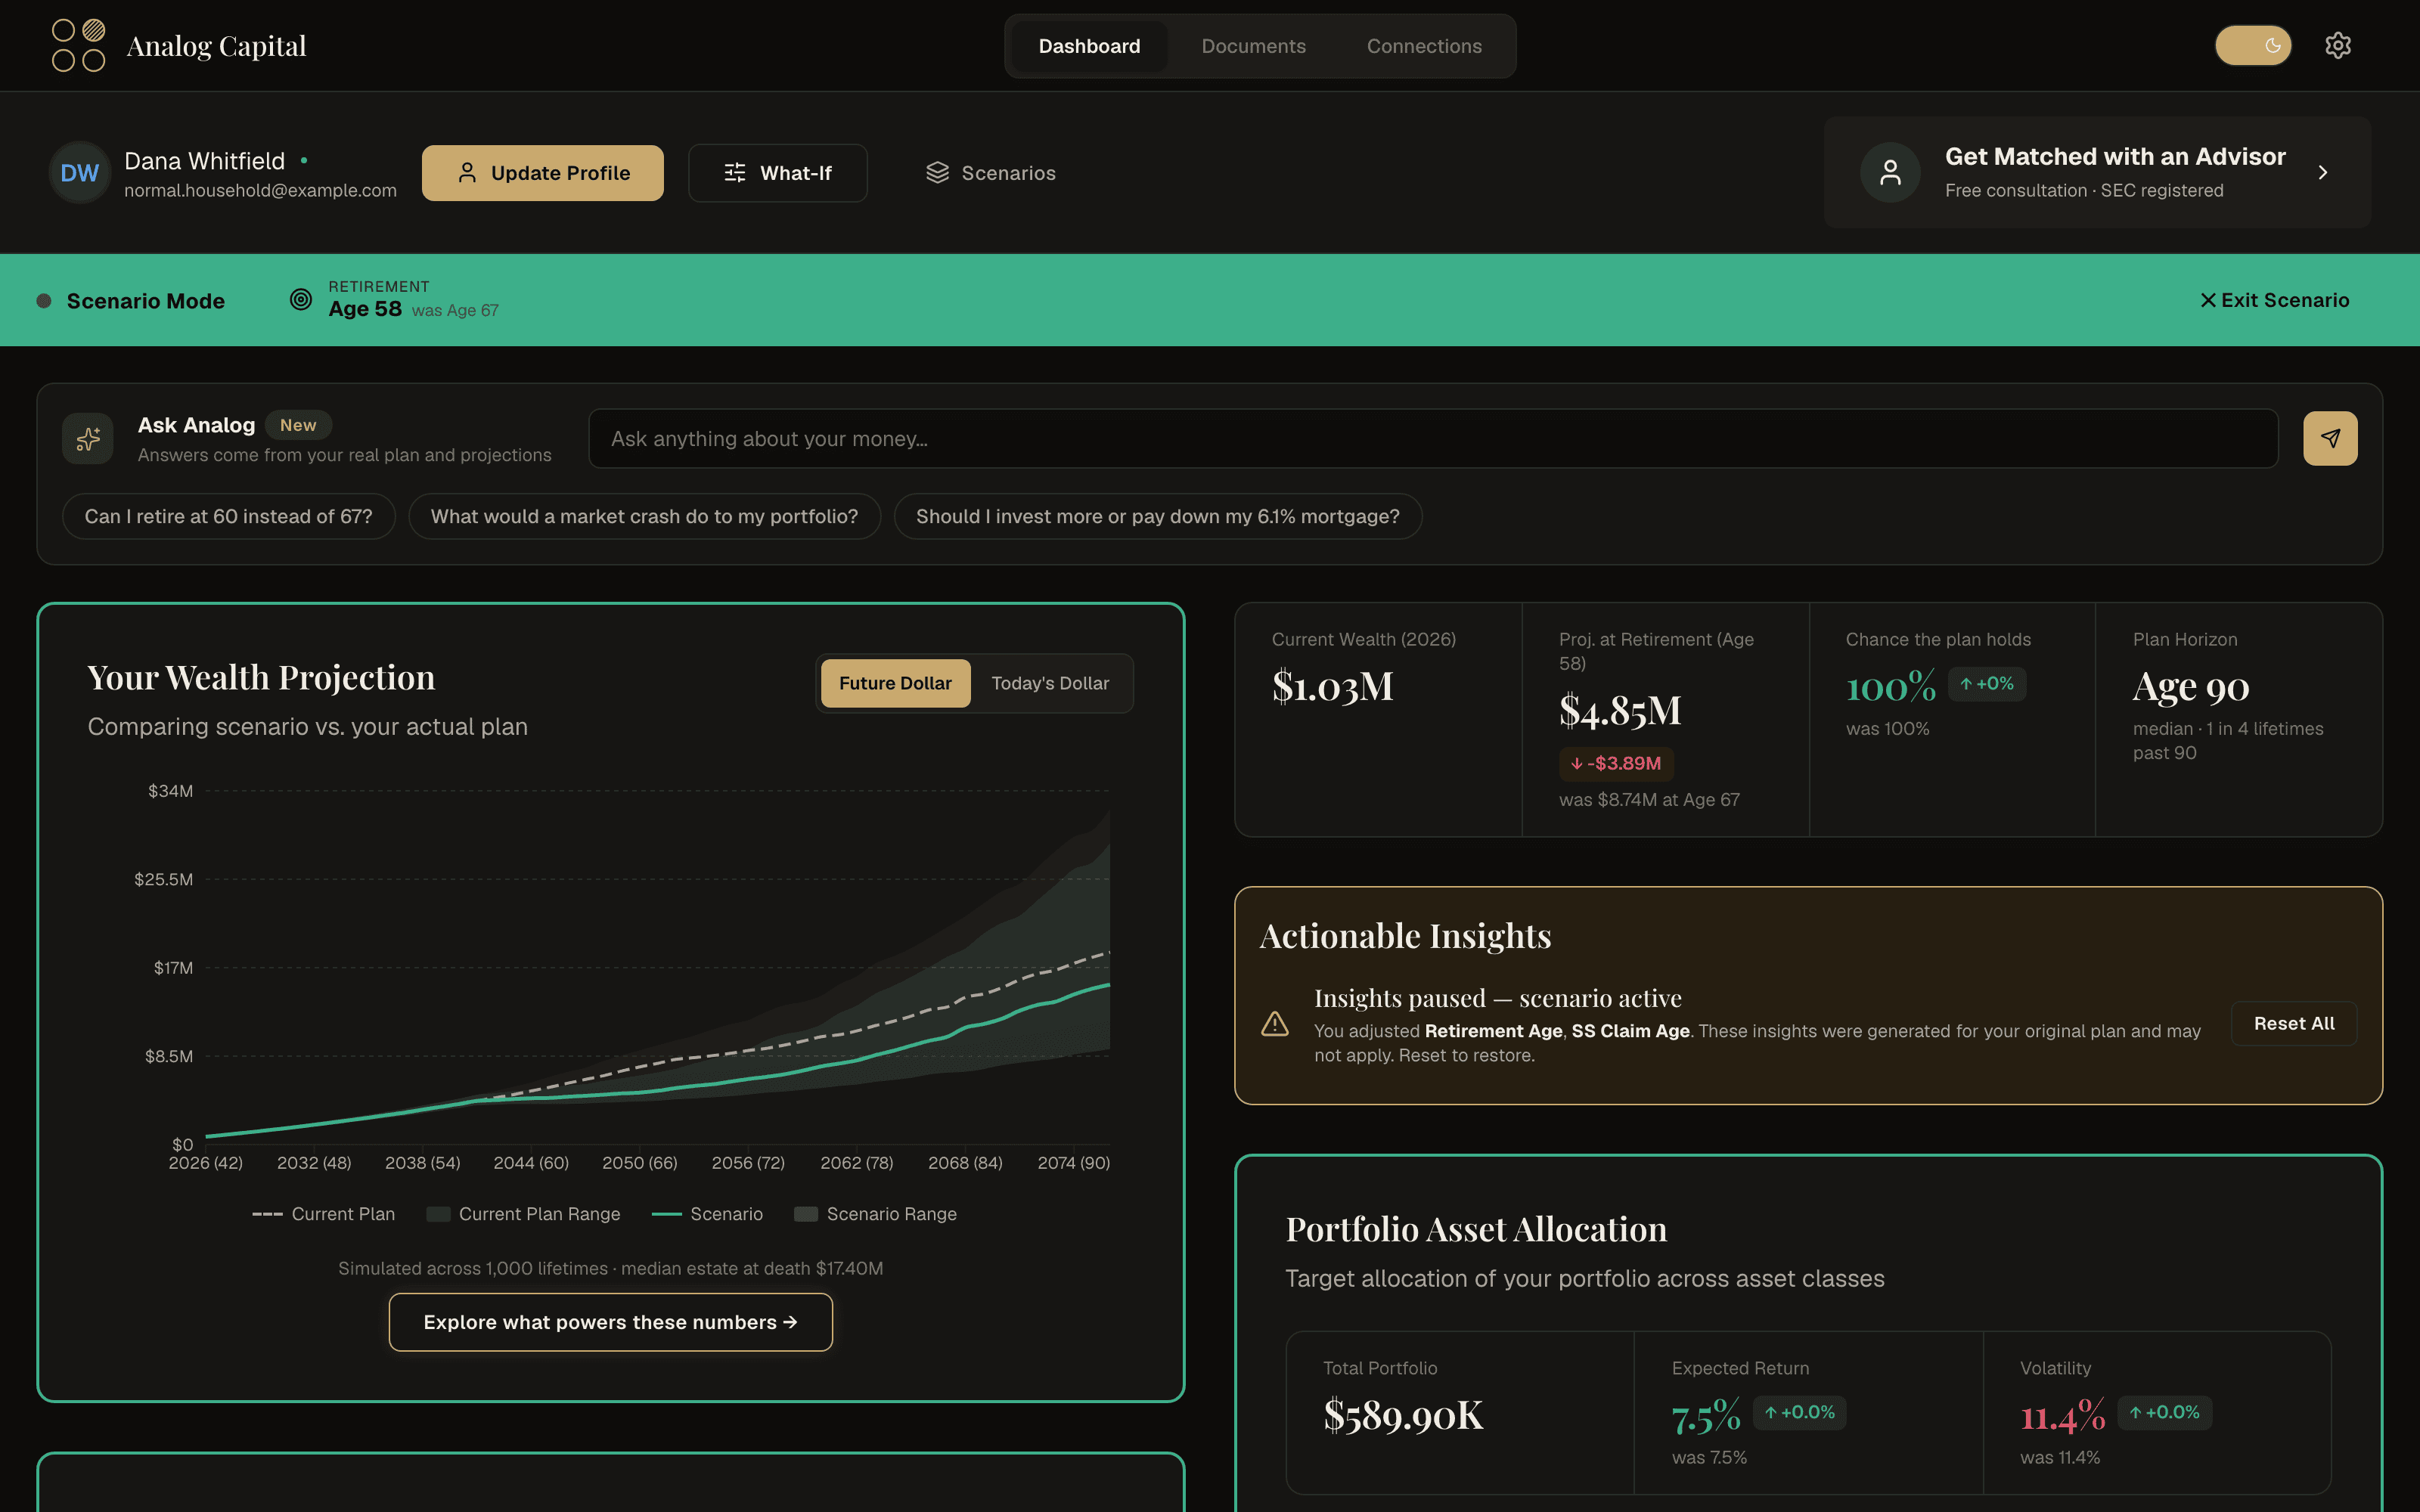
A scenario comparing the current plan and an alternative future on one chart
Change any of it, and both futures land on one chart — the trade-off in plain numbers.

Shown: a sample household, built with fictional data.

Six questions to ask any planning tool.

Can it show you the tax form behind any year of its projection?
Does anyone in its plan die early — and does the plan carry the consequence?
Would it ever tell you to cancel an insurance policy?
Does it know who inherits each account, and what that costs?
Can its assistant change the plan — with your approval — or only talk about it?
Does it solve for your answer — how much you can spend, how early you can stop — or just score the plan you typed in?

All six answers are about ten minutes of conversation away.

Start your plan →

Already have an account?Sign In

← Back to the overview